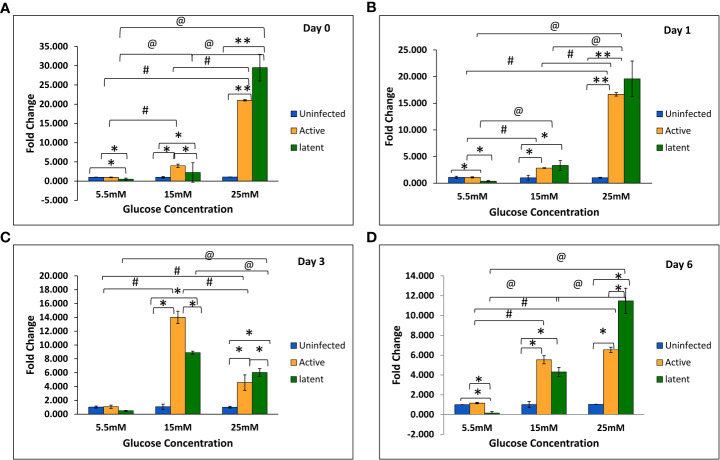
Figure 6.
Expression of the mmp-1 gene in the uninfected, active, and latent groups of THP-1 cells in the presence of different glucose concentrations at different time intervals. (A) On day 0 of infection. (B) On day 1 of infection. (C) On day 3 of infection. (D) On day 6 of infection. Values are Mean ±SE of three independent experiments. *p ≤0.05 represents the comparison between the uninfected, active, and latent groups within the same glucose concentration. **p ≤0.01 represents the comparison between the uninfected, active, and latent groups within the same glucose concentration. #p ≤0.05 represents the comparison between different glucose concentrations in the active group. @p ≤0.05 represents the comparison between different glucose concentrations in the latent group.

