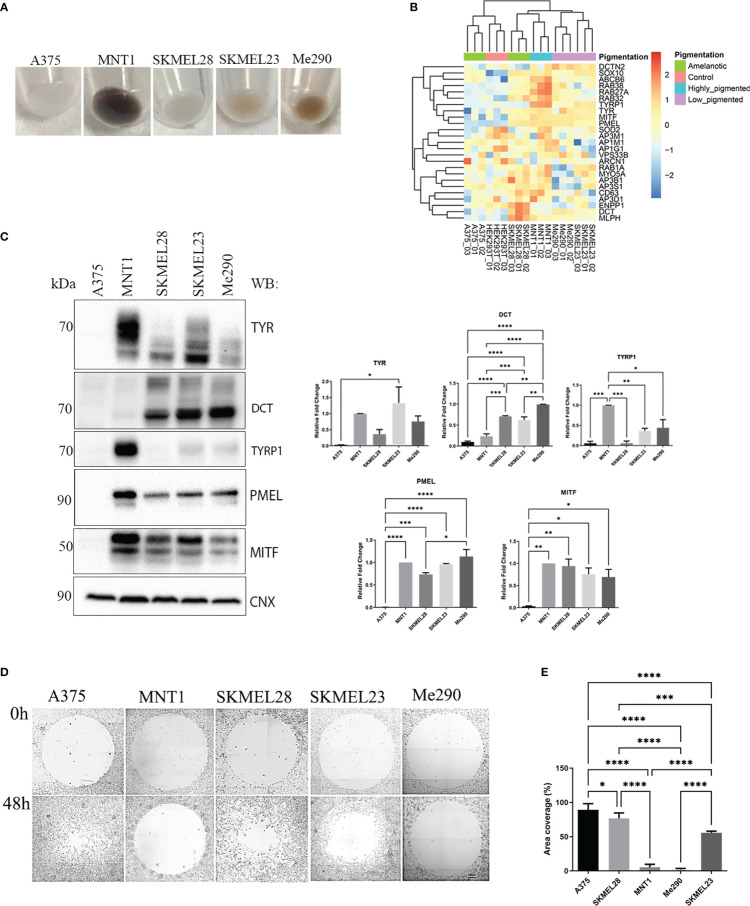
Figure 1.
Expression of melanin related proteins in pigmented and amelanotic melanoma cells and assessment of cells migration. (A) Visual comparison between amelanotic cells (A375, SKMEL28) and pigmented cells (MNT1, SKMEL23, Me290). (B) Heatmap representation of log2 transformed LFQ intensity values for proteins annotated for pigmentation (GO:0043473). (C) Western blot analysis of TYR, DCT, TYRP1, PMEL, microphthalmia-associated transcription factor (MITF) protein expressions in A375, MNT1, SKMEL28, SKMEL23 and Me290 and quantitative representation of relative protein expressions (one-way ANOVA analysis; ****p < 0.0001; ***p < 0.001; **p < 0.01; *p < 0.05; n=3). Data are presented as mean ± SEM (D) Migration assay for A375, MNT1, SKMEL28, SKMEL23 and Me290 melanoma cell lines over a period of 2 days. (E) Measurements of area coverage indicating the significant differences between the five cell lines (one-way ANOVA analysis; ****p < 0.0001; ***p < 0.001). The measurements were conducted on at least 3 replicates.

