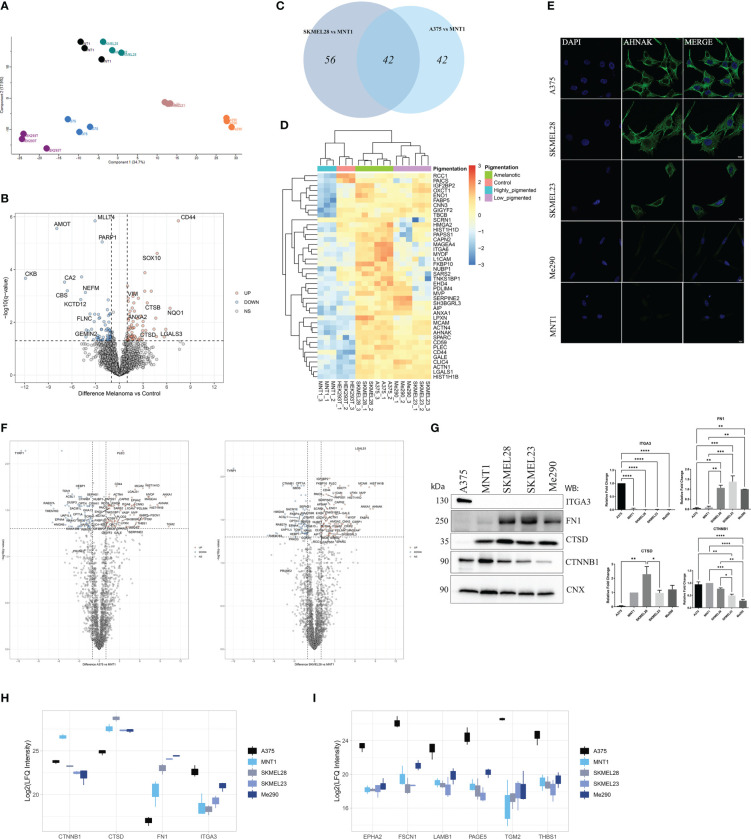
Figure 2.
LC-MS/MS proteome comparison of amelanotic versus pigmented melanoma cells. (A) Principal Component Analysis (PCA) showing clustering of samples according to their features. (B) Volcano plot of protein expression differences (log2FC) vs -log10(q value) from two sample t test of melanoma samples vs control (q-value<0.05 and absolute log2FC≥1) ( Supplementary Table 1, S1 ). (C) Venn diagram depicting shared upregulated proteins from the pairwise comparisons between A375 vs MNT1 and SKMEL28 vs MNT1. (D) Heatmap of log2 transformed LFQ intensity values showing the statistically significant shared up-regulated proteins from the comparisons between amelanotic cell lines (A375 and SKMEL28) and highly pigmented MNT1 cells (pairwise comparisons, two sample t test, q-value<0.05 and log2FC≥1) ( Supplementary Table 1, S1 ). (E) Immunofluorescent staining of AHNAK in A375, SKMEL28, SKMEL23, Me290 and MNT1 cell lines. (F) Volcano plots highlighting differentially expressed proteins from the pairwise comparisons between amelanotic cells and highly pigmented MNT1 cells (q-value<0.05 and absolute log2FC≥1) ( Supplementary Table 1, S1 ). (G) Western blotting assays and intensity band quantification for ITGA3, FN1, CTSD and CTNNB1 protein levels (one-way ANOVA analysis; ***p <0.001; **p<0.01; *p<0.05, n=3). Calnexin (CNX) was used as internal control. Data are presented as mean ± SEM. (H) Box plot of log2 transformed LFQ intensity values of CTNNB1, CTSD, FN1 and ITGA3 ( Supplementary Table 1, S1 ). (I) Box plot of log2 transformed LFQ intensity values for EPHA2, FSCN1, LAMB1, PAGE5, TGM2 and THBS1 ( Supplementary Table 1, S1 ).

