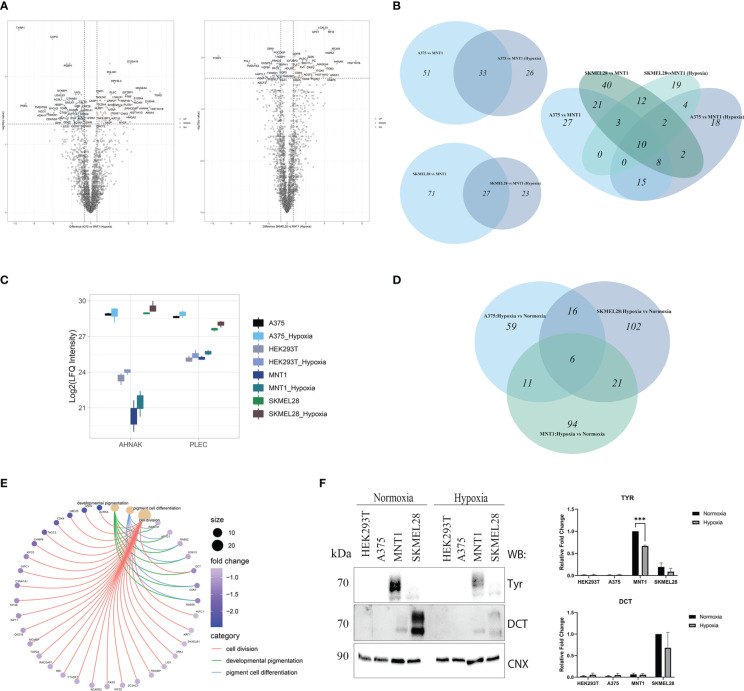
Figure 5.
LC-MS/MS proteome analysis of melanoma cells in hypoxia. (A) Volcano plots representing the protein expression changes under hypoxia in the comparisons between amelanotic and highly pigmented cells (pairwise comparisons, q value<0.05, absolute log2FC ≥1) ( Supplementary Table 1, S1 ). (B) Venn diagrams depicting unique and shared sets of up-regulated proteins from the comparisons between amelanotic and highly pigmented cells in normoxia and hypoxia (C) Box plot of log2 transformed LFQ intensity level of AHNAK and PLEC. (D) Venn diagram depicting unique and shared sets of up-regulated proteins in melanoma cell lines after cell exposure to hypoxia (log2FC≥1). (E) Cnet plot depicting the linkages between core enriched proteins for processes that were significantly enriched, coming from the comparison between melanotic cells cultured under hypoxia vs normoxia ( Supplementary Table 1 , GSEA MNT1 Hypoxia vs Normoxia). (F) Western blot analysis of TYR and DCT under normoxia and hypoxia. Calnexin was used as loading control. Western blot densitometry band quantification for TYR and DCT is presented as the mean ± SEM (two-way ANOVA with Sidak multiple comparisons test; ***p < 0.001, n=3).

