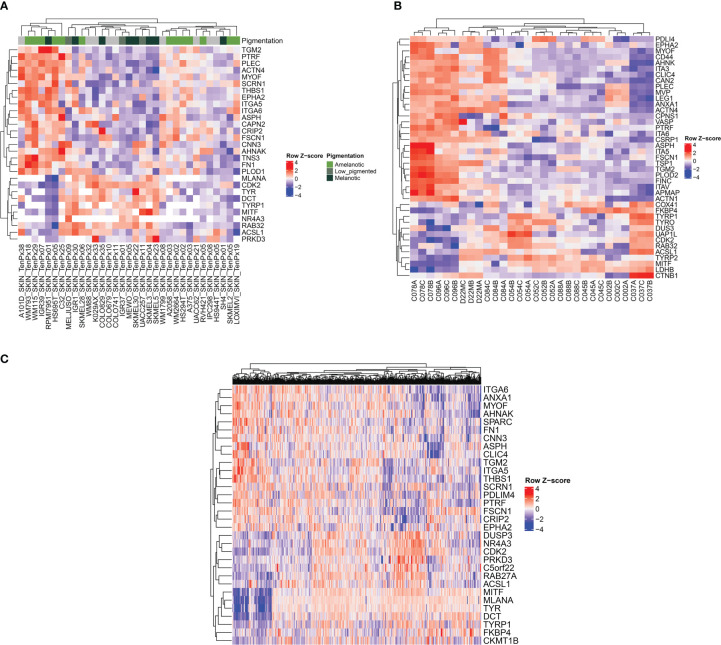
Figure 6.
Heatmap representations showing the relationship between melanogenetic proteins and selected proteins identified in this study. The analysis was conducted on three different public datasets. (A) Heatmap of z-score of normalized protein expression values for selected proteins identified in 33 melanoma cell lines (52). (B) Heatmap of z-score of normalized protein area (log2) for selected proteins. Three biological replicates isolated from patients with melanoma are represented (53). (C) Heatmap of RNA-seq expression z-scores (RSEM z score) for selected protein-coding genes of 442 melanoma patients (54).

