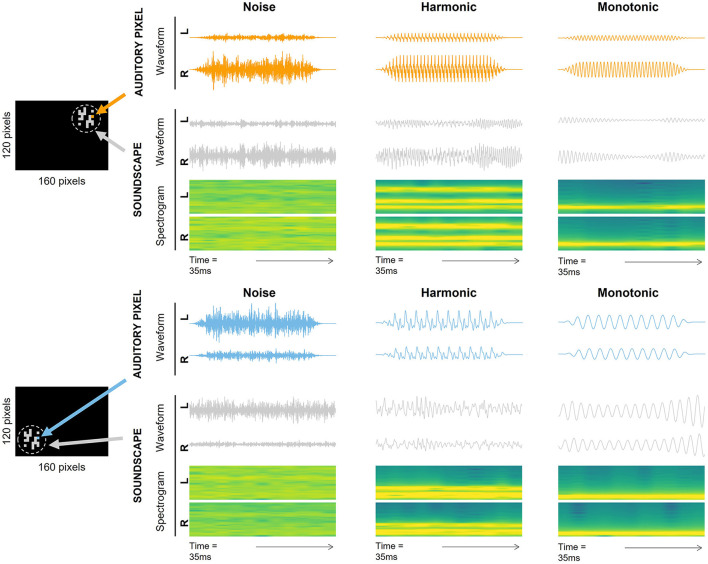
Figure 2.
Two examples of processed video frames and their corresponding soundscapes. The two processed video frames are depicted in the left side of the figure with a target located on the upper right (top image) and bottom left (bottom image). Active and inactive graphical pixels are depicted in gray and black, respectively. Two graphical pixels are highlighted in the video frames (orange in the top image, blue in the bottom image) and the corresponding auditory pixel waveforms are depicted in the right part of the figure in orange and blue. The corresponding soundscape waveforms (in gray) and soundscape spectrograms of the video frames are also depicted in the right part of the figure. Auditory pixel waveforms, soundscapes waveforms and spectrograms are displayed separately for the Noise encoding (left column), the Harmonic encoding (middle column) and the Monotonic encoding (right column) and for left (L) and right (R) ear channels separately.

