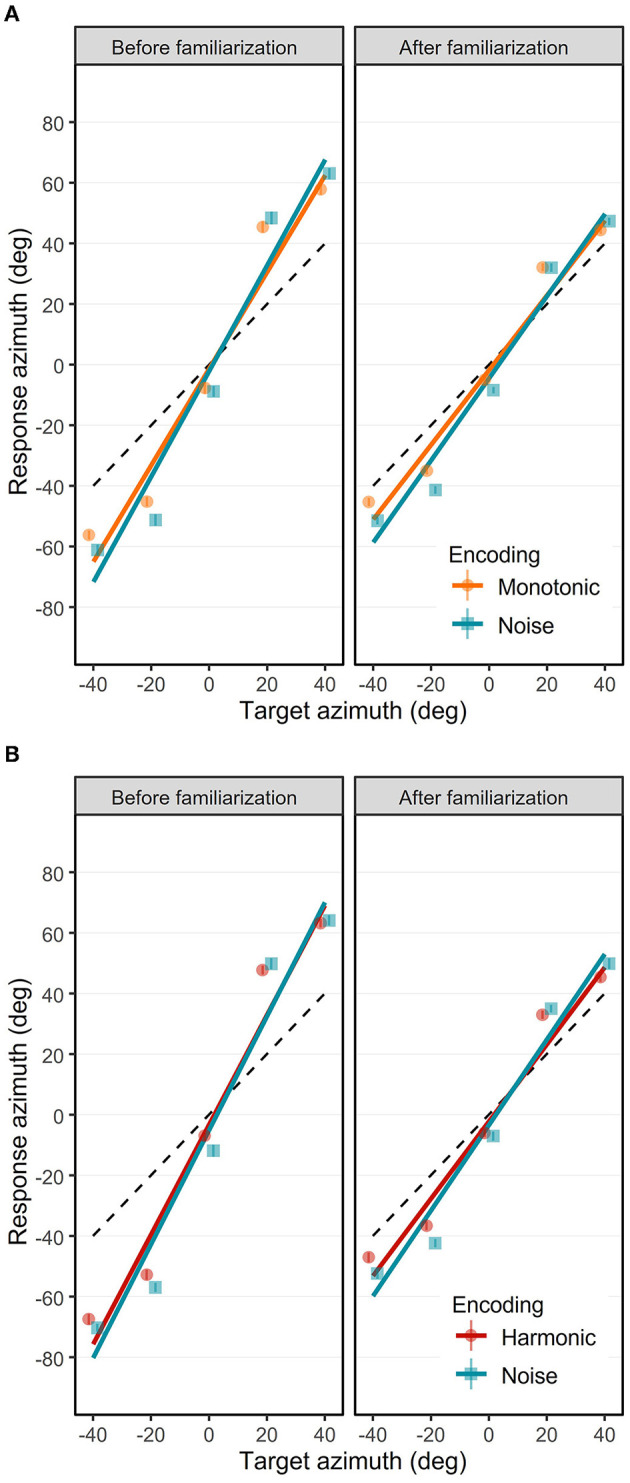
Figure 6.

Azimuth response position as a function of target azimuth in the Monotonic group (A) and the Harmonic group (B). Mean azimuth response positions (in degree) before (left) and after (right) are represented separately for the three visual-to-auditory encodings: the Noise (blue squares), the Monotonic (orange circles) and the Harmonic (red circles) encodings. Error bars show standard error of azimuth response position. Solid lines represent the azimuth gains with the Noise (blue), the Monotonic (orange) and Harmonic (red) encodings. Black dashed lines indicate the optimal azimuth gain 1.0.
