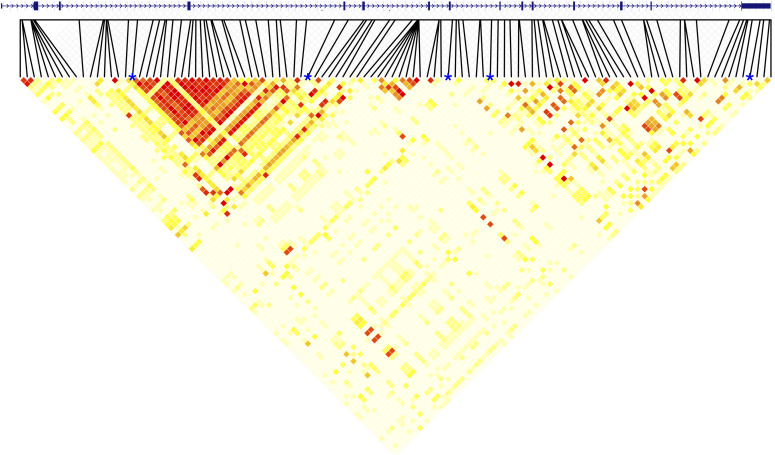
Figure 4. Heatmap of correlations between all SNPs and VNTRs in SLC6A3.
The gene is shown in the 5′ to 3′ orientation above the heatmap, with black lines indicating the location of each SNP. The five VNTRs are denoted with a blue asterisk above the heatmap, with TR09 on the far left and TR30 on the far right. On the heatmap, red indicates a stronger correlation and white indicates a weaker correlation.

