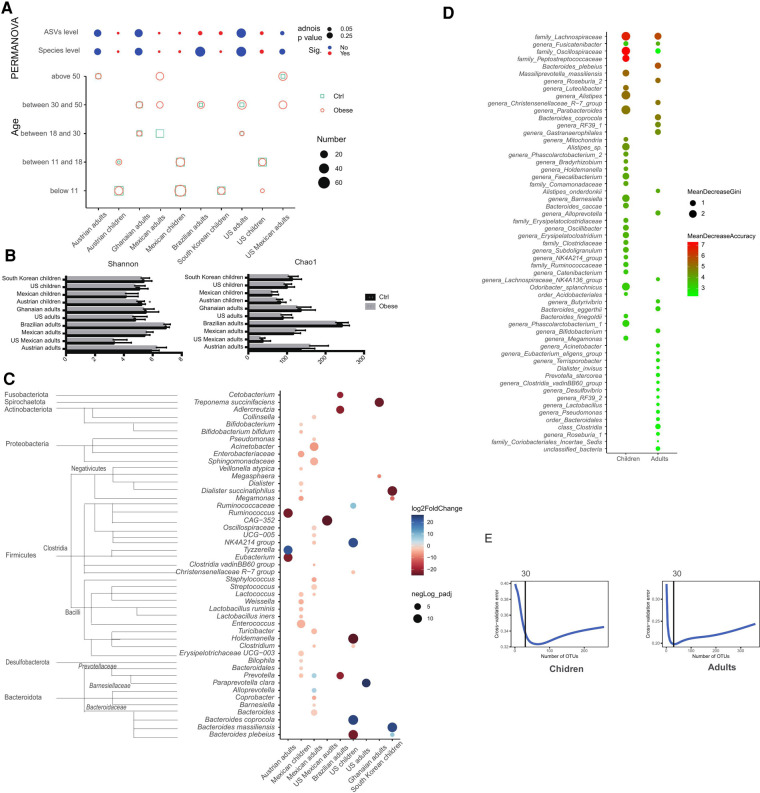
Figure 1.
Comparison of gut microbiota between obese and control groups in different cohorts. (A) Distance of gut microbiota between obese and control individuals analyzed using PERMANOVA and age distributions in different cohorts; (B) Alpha diversity of gut microbiota in different cohort; (C) Bacteria with significant difference in abundance between control and obese individuals in different cohorts (Blue means bacteria had higher abundance in control group than obese group, vice versa); (D) Top 30 taxa used to predict obesity using the random forest model; (E) Cross validation errors of both children cohorts and adults cohorts in random forest model.

