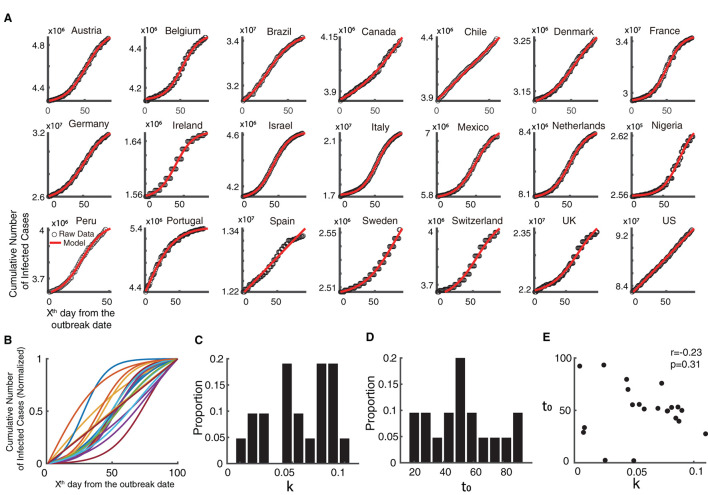
Figure 2.
Temporal dynamics of the ongoing COVID-19 epidemic. (A) Raw data of the cumulative infected cases of COVID-19 is shown in black dots and the fitted curve of the model is shown in red, in the same time interval as the monkeypox epidemic. (B) Normalized fitted curves of model for 21 countries. (C) Distribution of growth rate (k). (D) Distribution of semi-saturation period (t0). (E) Relationship between growth rate (k) and semi-saturation period (t0).

