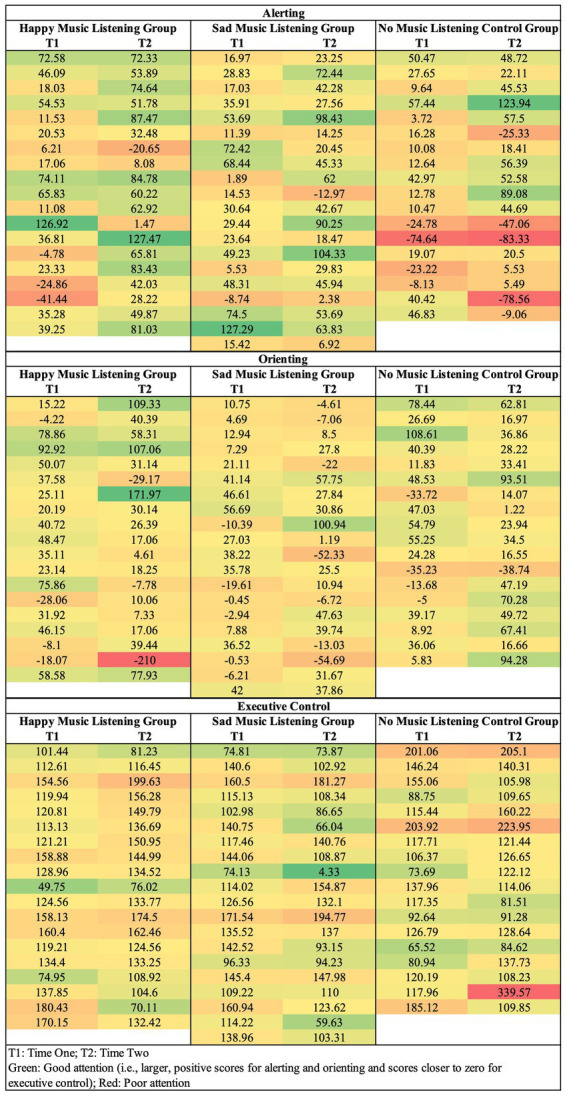
Figure 4.

Individual variation in how alerting (reaction time difference score for no cue–double cue), orienting (reaction time difference score for center cue–valid spatial cue), and executive control (reaction time difference score for incongruent–neutral trials) change from time one to time two for each participant. Green shading represents better attention and red shading poorer attention. The individual data depicts a similar pattern as the whole-group analysis: alerting attention predominately changes in response to happy music and executive control in response to sad music.
