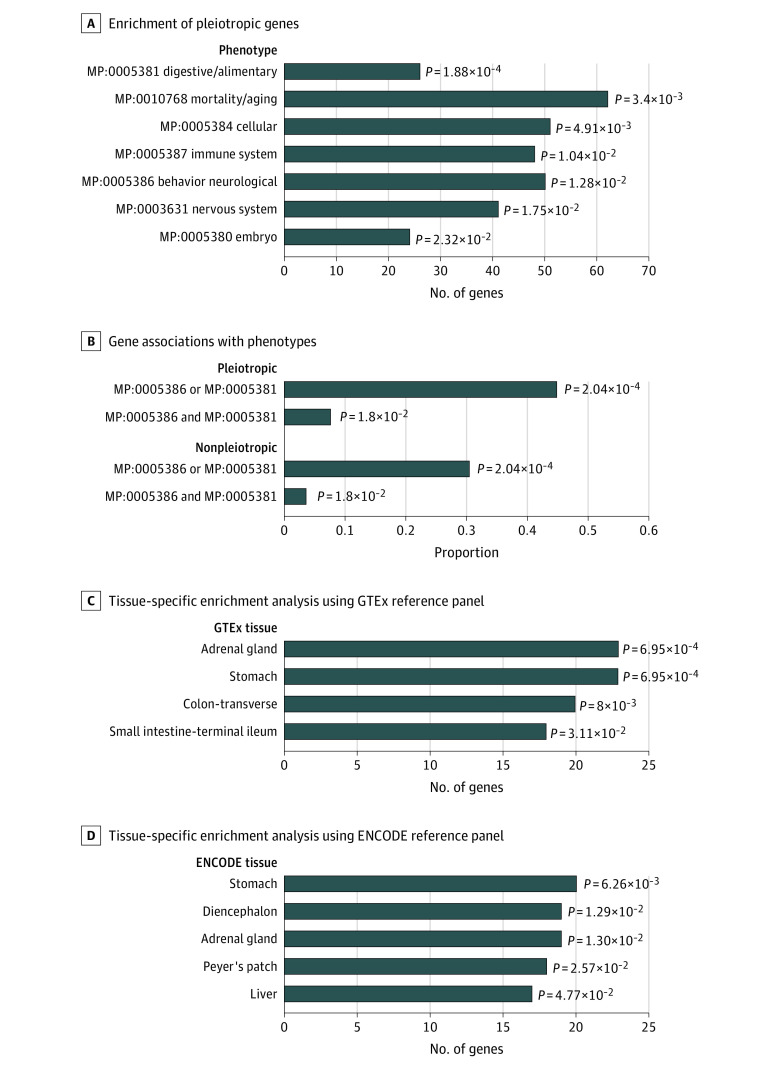
Figure 3. Phenotype and Tissue Specificity for Candidate Pleiotropic Genes.
Phenotype enrichment analysis based on existing mouse/human orthology with phenotype annotations from the Mouse Genome Informatics platform suggested 7 phenotypes in which the significant pleiotropic genes were enriched (A) and both the proportions of the genes associated with at least 1 of 2 gut-brain axis–related phenotypes or associated with both phenotypes (behavior-neurological phenotype and digestive-alimentary phenotype) in the pleiotropic gene group were higher (B). Detailed information of phenotype annotations for these genes was provided in eTable 10 in Supplement 1. Tissue-specific enrichment analysis using the deTS method based on 2 reference panels showed higher tissue specificity, 4 significantly enriched tissues were identified when using the Genotype-Tissue Expression project (GTEx) reference panel (C), and 5 were identified when using the Encyclopedia of DNA Elements project (ENCODE) reference panel (D). Detailed information of tissue-specific genes was provided in eTables 11 and 12 in Supplement 1. We declared the nominally significant threshold (2-sided P < .05) in both analyses.

