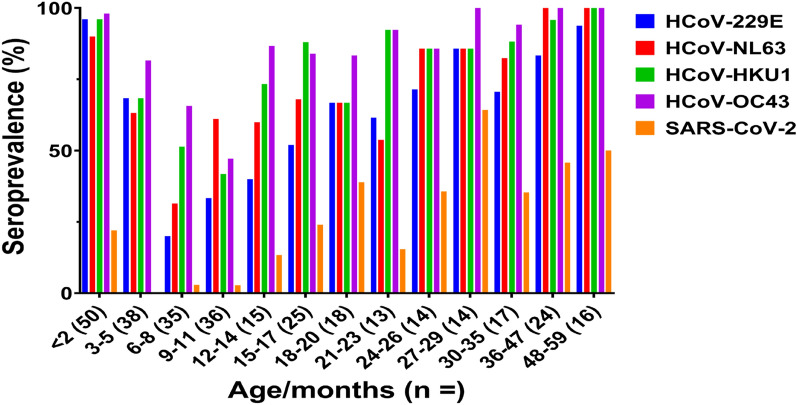
Figure 1.
Seroprevalence of four endemic HCoVs and SARS-CoV-2 among different age groups of children who were collected before the COVID-19 pandemic (2015–2018) in the Philippines. The bar chart represents the percentage of serum samples that were positive for HCoV-229E (blue), HCoV-NL63 (red), HCoV-HKU1 (green), HCoV-OC43 (purple), and SARS-CoV-2 (orange) in each age group. The number of samples per age group is indicated in brackets.

