Figure 6.
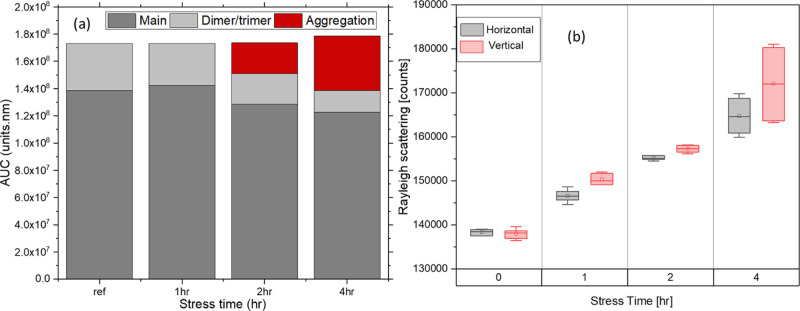
(a) SEC peak areas for 100 mg/mL BSA under different temperature-induced stress levels. Each sample is kept at 75 °C for periods of 1, 2, and 4 h. The decrease in the monomer peak area is accompanied by the appearance and increase of an aggregation peak that elutes slightly earlier than the main peak conglomerate. (b) The area under the curve for Rayleigh scattering was observed for the same samples. All the measurements are done in triplicate (n = 3).

