. 2023 Jan 16;15(6):2849–2859. doi: 10.1039/d2nr05368c

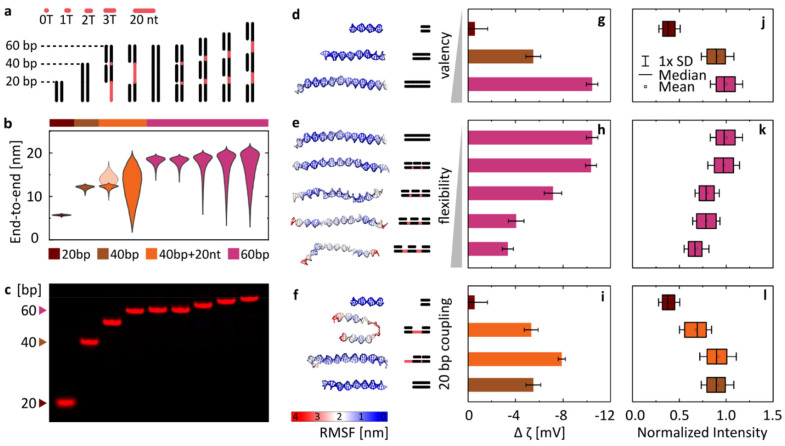
Fig. 3. Varying the DNA design affects the magnitude of its binding to lipid bilayers (gel phase) in the presence of MgCl2. (a) Schematic overview of the library of linear DNA constructs. Single-stranded regions are highlighted in red. (b) Violin plots of end-to-end distances between dsDNA regions obtained from coarse-grained simulations. The semi-transparent plot for the third structure (==−) represents the distance between the double and single-stranded termini of the nanostructure. (c) PAGE analysis of the Cy5-labelled duplexes. (d–f) Last frames from coarse-grained simulations of DNA structures, mapping their root-mean-square-fluctuations (RMSF). (g–i) Changes in ζ potential when transitioning between the liquid and gel phases (defined as in Fig. 2b) for the library of duplexes. Measurements were performed in 2 mM Mg2+. Error bars represent standard deviation from at least three measurements, each consisting of at least 15 runs. (j–l) Fluorescence signal observed around DPPC vesicles under the confocal microscope, indicating attachment of Cy5-labelled duplexes. Imaging was performed in 1 mM Mg2+. Box plots represent values measured from at least 200 vesicles (details in Table S3).

Fig. 3