. 2023 Jan 16;15(6):2849–2859. doi: 10.1039/d2nr05368c

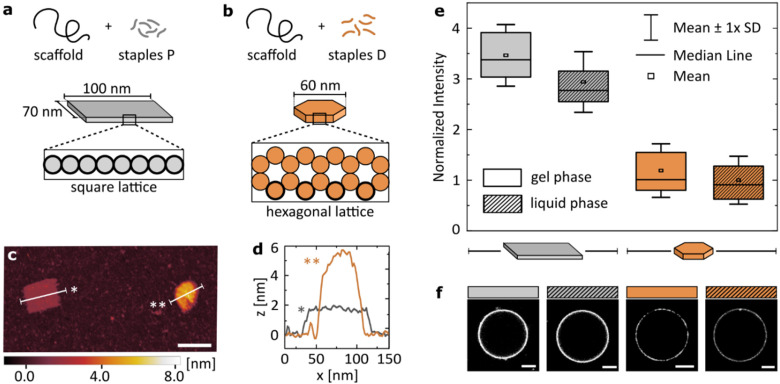
Fig. 4. Structural details of the DNA origami design determine the magnitude of its binding to lipids. Geometric details of the two studied origami designs: (a) large, single-layered DNA plate and (b) more densely packed, smaller DNA disk. Cross-sections of the designs highlight helices in direct contact with the surface (bold outline). (c) Representative AFM image showing the two structures. Scale bar: 100 nm. (d) Plot profiles as marked on the image in (c). (e) Fluorescence intensity of Alexa488-labelled (6×) DNA origami, coating vesicles either in gel (DPPC) or liquid (DOPC) phase. Imaging was performed in 12 mM Mg2+. All values normalized to the mean value obtained for the disk binding to lipids in the liquid phase, are corrected by the yield of the fluorescent labelling of each structure. Box plots represent values measured from at least 50 vesicles (details in Table S4). (f) Representative confocal images of the respective fluorescent signal, corrected by the yield of the fluorescent labelling of each structure. Scale bars: 5 μm.

Fig. 4