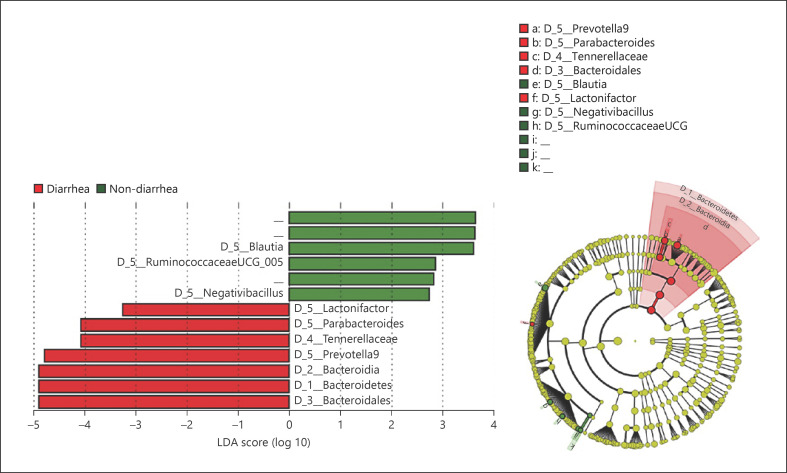
Fig. 3.
Comparison of relative abundance of bacterial communities between groups performed with LEfSe. The graph shows a comparison of the relative abundance of bacterial communities between both groups performed with LEfSe. Red bars show bacterial communities with a higher relative abundance in the diarrhea group, and green bars represent bacterial communities that were more abundant in the nondiarrhea group. The genera Parabacteroides and Prevotella9 and the family Tannerellaceae are members of the order Bacteroidales. LEfSe, linear discriminant analysis effect size.

