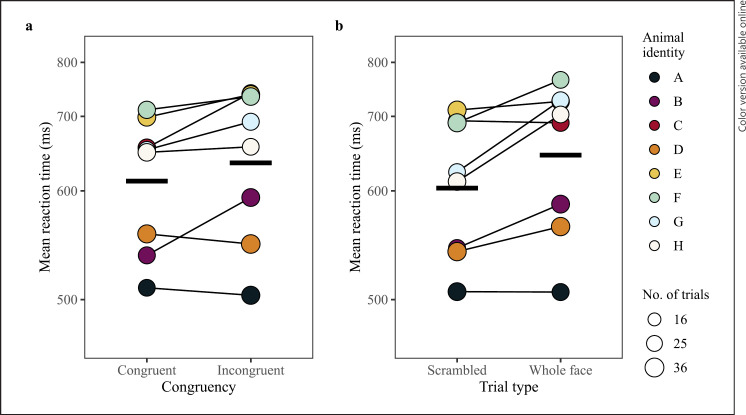
Fig. 2.
Investigating if our dot-probe task can detect differences in monkeys' responses to dot-probe task parameters (congruency and trial type) during the baseline test session for 100 ms trials. a Mean reaction time per monkey to congruent and incongruent trials, connected by a thin black line. b Mean reaction time per monkey to scrambled or whole face trials, connected by a thin black line. The point area indicates the number of trials per condition, ranging from 28 to 35 trials. The Y-axes are scaled according to the transformed data. Model estimates are indicated by thick horizontal lines for each condition when all other predictors are at their mean (either dummy coded or z-transformed).

