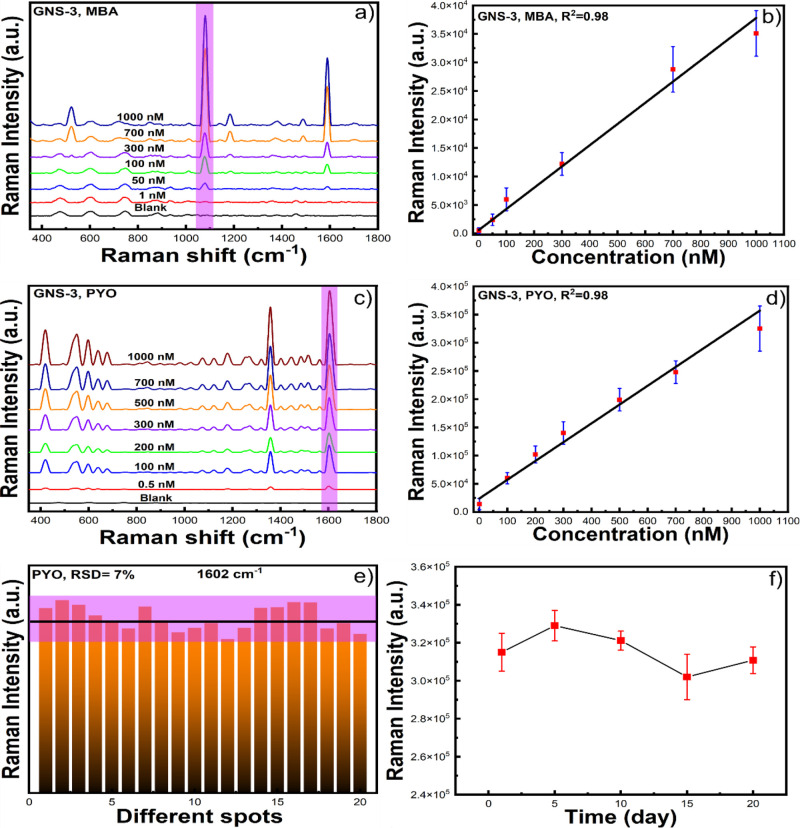
Figure 4.
SERS intensity of MBA at 1078 cm–1 at different concentrations from 1 μM to 1 nM (a), and the corresponding calibration curve (b) with GNS-3. SERS spectra of PYO at different concentrations (from 1 μM to 0.5 nM) and the blank substrate (c) and the corresponding calibration curve (d) with GNS-3. SERS intensity of PYO at 1602 cm–1 for 20 different sample spots (e) and different time intervals (f) which shows that our solution-based SERS substrate is reproducible and stable.

