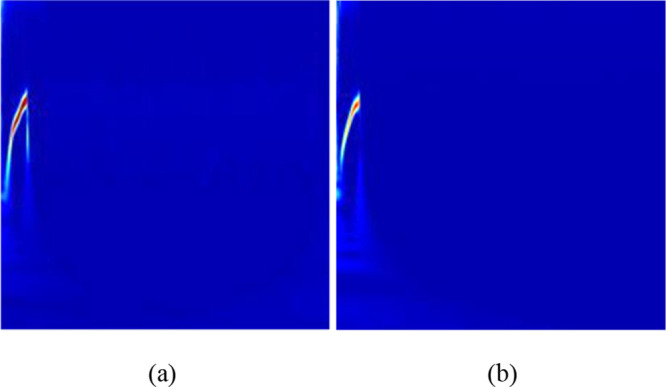
Figure 6.

Comparison of pseudocolor images for two different liquids generating similar responses when using a sensor head with a different surface. (a) Pseudocolor scalogram image for ethyl acetate using a response signal from an innate cleaved surface and (b) for isooctane from a hydrophobic surface.
