
Figure 1.
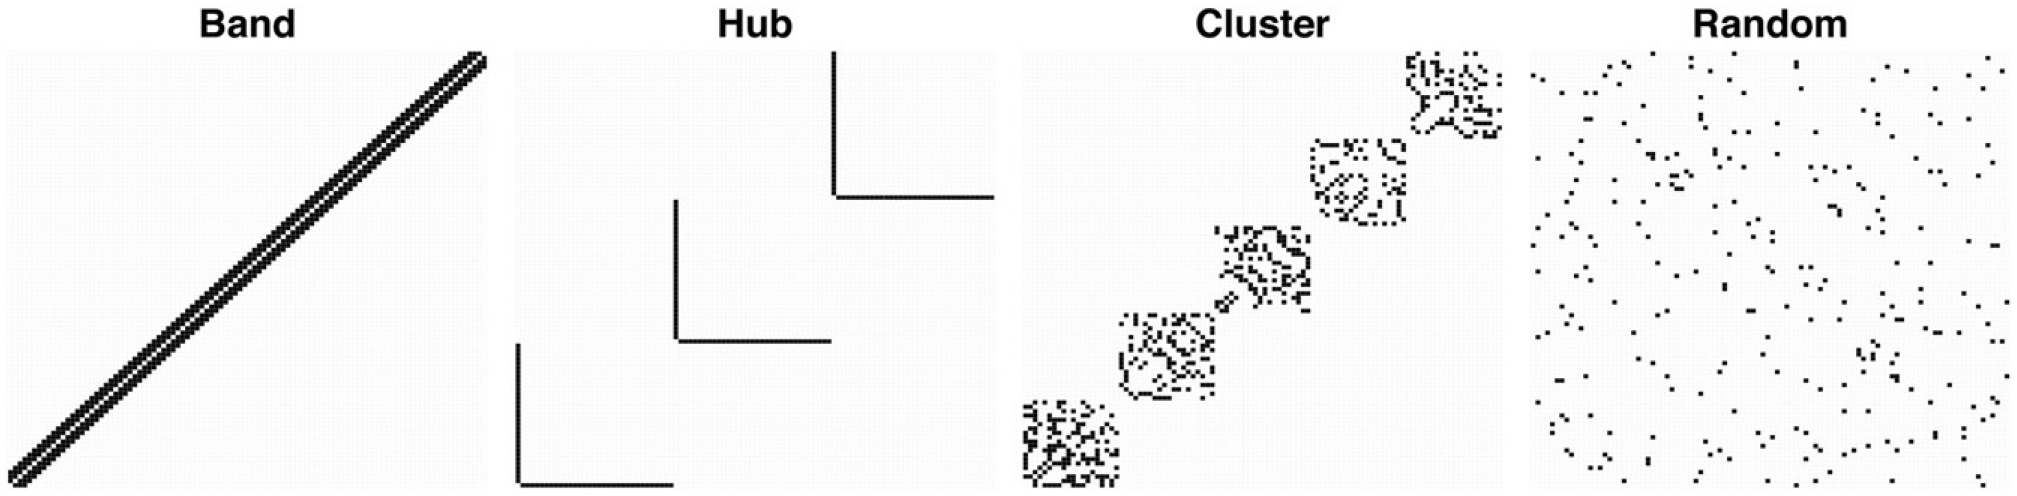
Simulation study: Example networks used in the simulation studies. Black boxes represent true edges, and light gray boxes correspond to no edge. For the cluster and random graphs, the actual networks that generated the data were different for each simulated dataset, but each simulation kept the blocked shape or random network, respectively.