
Figure 2.
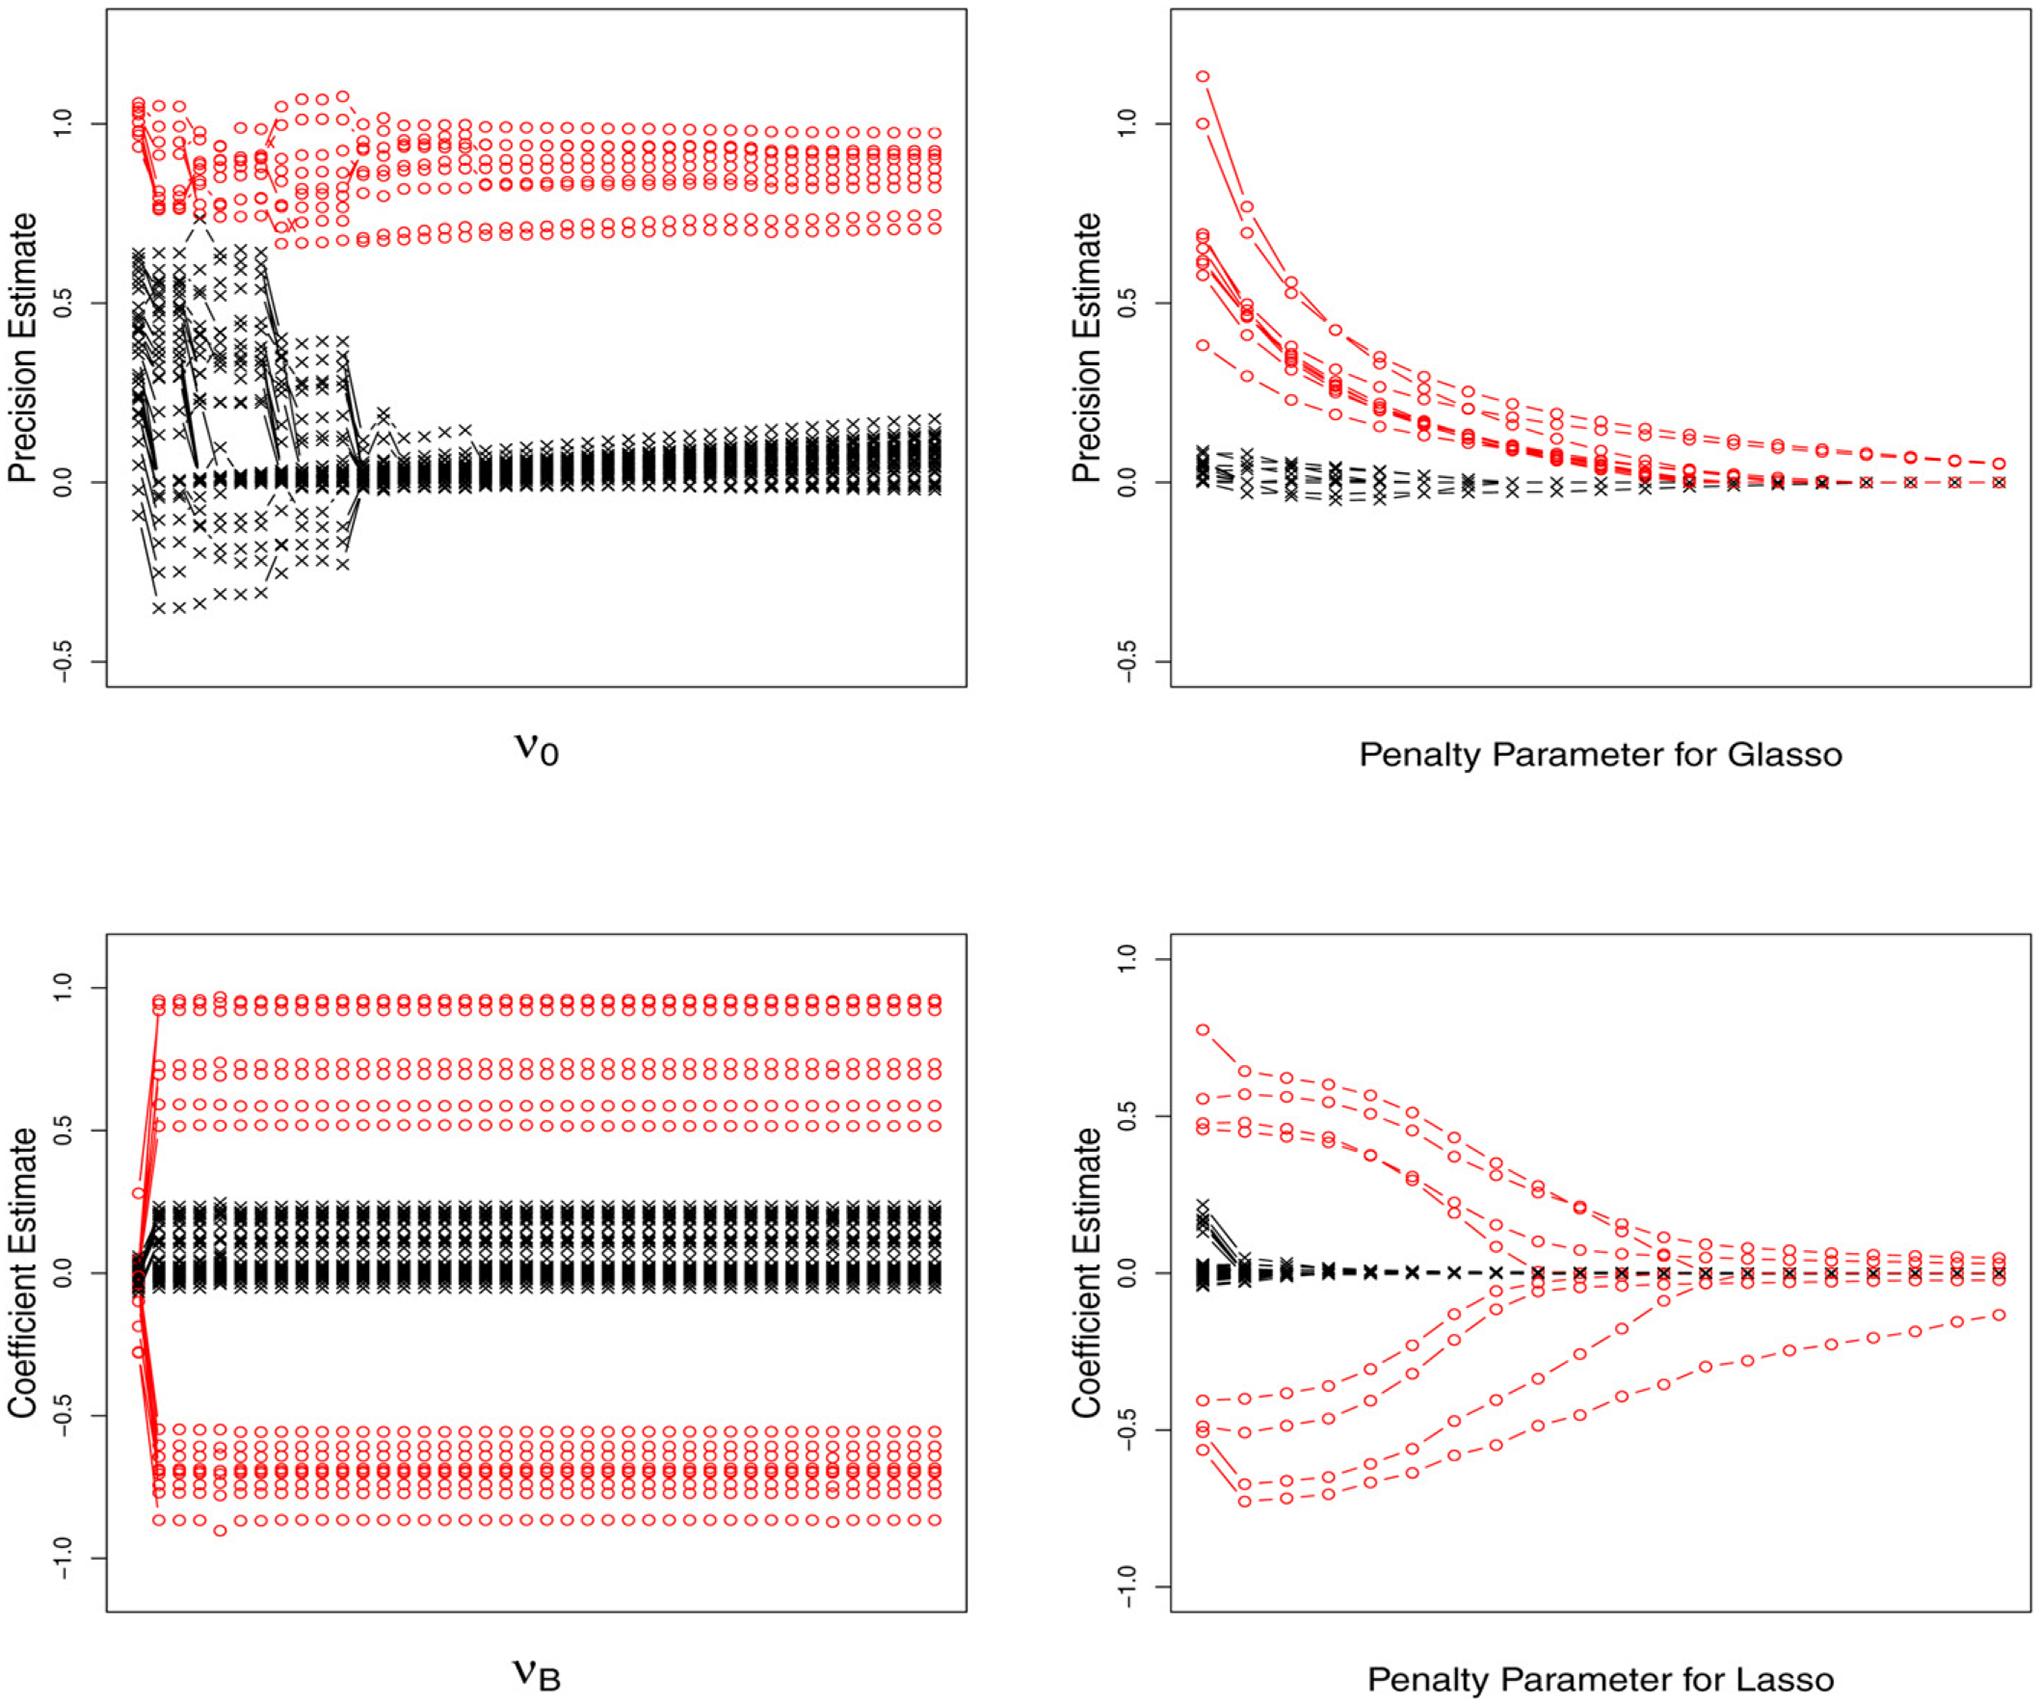
Simulation study: The top-left plot shows the estimated B coefficients by the proposed model when increasing the variance parameter νB of the spike-and-slab prior (2). The top-right plot shows the estimated B coefficients via mLDM when increasing the LASSO penalty parameter. The bottom-left plot shows the estimated off-diagonal values of the precision matrix when increasing the variance parameter ν0 in Equation (3) and the bottom-right plot shows the estimated off-diagonal estimates of the precision matrix when increasing the graphical LASSO penalty parameter. In all plots, -o- lines correspond to true associations in the simulated data, and -x- lines correspond to coefficients representing no underlying association.