Figure 4.

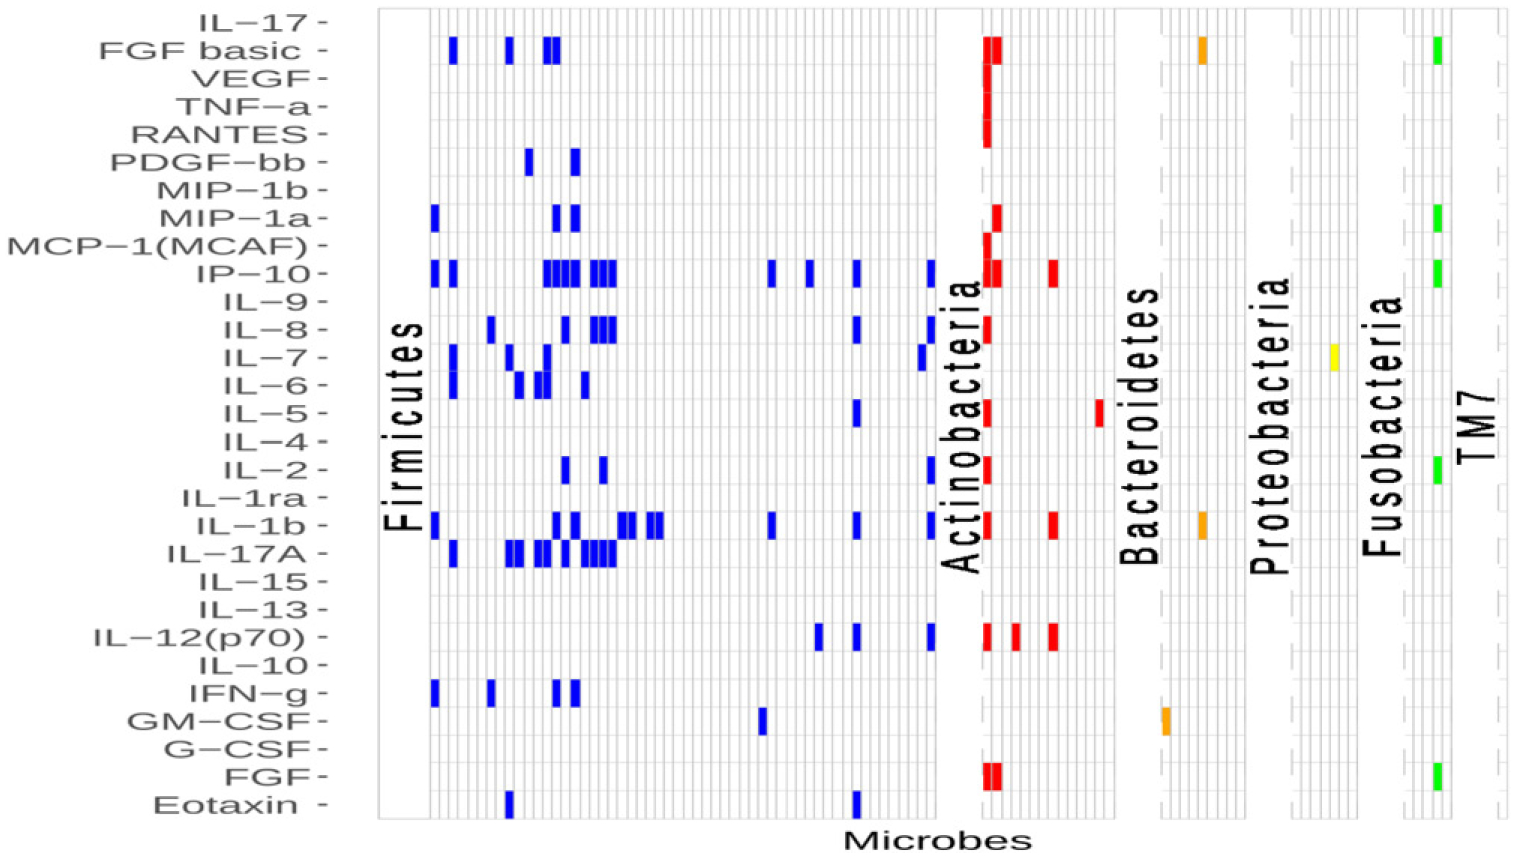
Case study: Adjacency matrix of the cytokine and microbial associations inferred from the MOMS-PI data. Filled boxes indicate that there is an association between a cytokine (plotted on the y axis) and an OTU (plotted on the x-axis).

Case study: Adjacency matrix of the cytokine and microbial associations inferred from the MOMS-PI data. Filled boxes indicate that there is an association between a cytokine (plotted on the y axis) and an OTU (plotted on the x-axis).