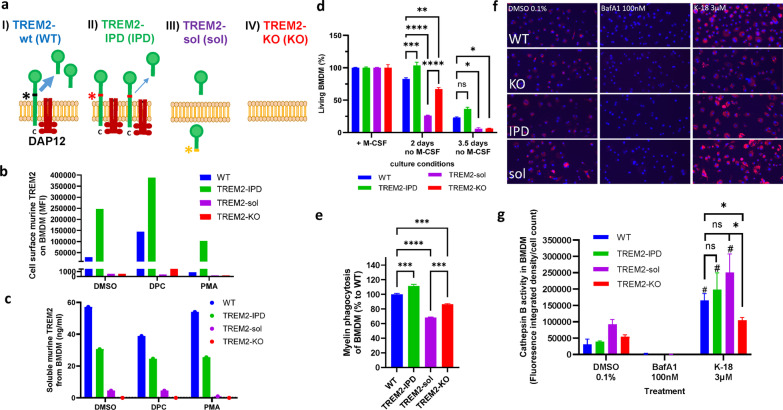
Fig. 1.
Characterization of BMDM from wild-type, TREM2-IPD, TREM2-sol and TREM2-KO mice. a Schematic representation of the TREM2 receptor. Black, red and yellow asterisks indicate the cleavage site in WT, the mutated cleavage site in TREM2-IPD and in TREM2-sol, respectively. b Flow cytometry analysis of murine cell surface TREM2 on BMDM. MFI: median fluorescence intensity. Sheddase inhibitor: DCP333 (DPC), sheddase activator PMA. c Analysis of supernatants from b of murine soluble TREM2 from BMDM. d ATP-based cell survival assay of BMDM upon M-CSF deprivation for 2 and 3.5 days. ATP levels of cells cultured with M-CSF (n = 7) were set as 100% survival and compared to the ATP concentration after 2 (n = 4) and 3.5 days (n = 3) without M-CSF for each genotype. Statistics: Holm–Sidak’s two-way ANOVA multiple comparisons (*p ≤ 0.05, **p ≤ 0.01, ***p ≤ 0.001, ****p ≤ 0.0001). e In vitro phagocytosis capacity of BMDM over 12 h (area-under-the curve) with 5 µg pHrodo-myelin per well (n = 3). Fluorescence measurements in wells without prey were used as controls (data not shown). f Representative images of the Cathepsin B activity assay taken by the In-Cell Analyzer. The nuclei are stained with DAPI (blue), and the red fluorescence signals are derived from cleaved Magic red. g Quantification of the Cathepsin B assay images. The fluorescence integrated density of the Magic red signal was measured and normalized to the nuclei count. A significant (p < 0.05) increase in normalized fluorescence between the DMSO control and K-18 within one genotype is marked by #. Statistics for d and g: Holm–Sidak’s two-way ANOVA with multiple comparisons (*p ≤ 0.05, **p < 0.01, ***p < 0.001, ***p < 0.0001). Statistics for e: One-way ANOVA test with Holm–Sidak’s multiple comparisons test (***p < 0.001; ****p < 0.0001). All data are presented as means ± SEM

