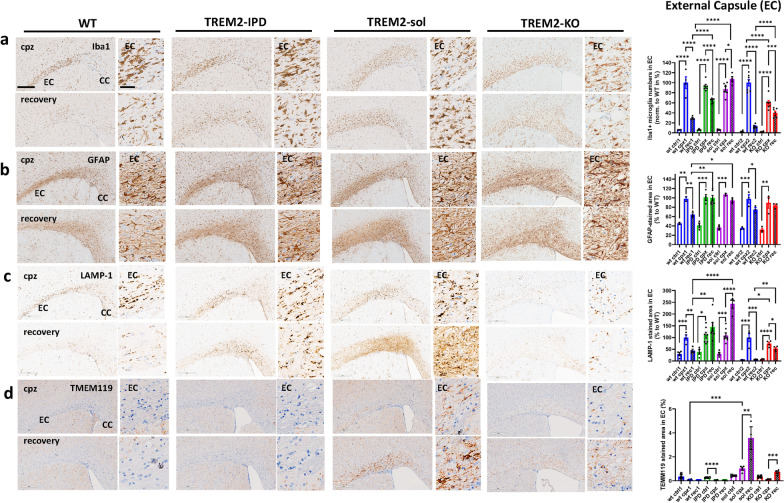
Fig. 5.
TREM2-IPD and TREM2-sol mice show both sustained microglia/astrocyte activation and enhanced LAMP-1 in the EC. Representative images for the different genotypes and timepoints from histological stainings detecting a Iba1 and corresponding image analysis of Iba1-positive soma numbers (normalized to WT at week 5 cuprizone), b astrocytes (GFAP) and corresponding image analysis (GFAP-stained area in %), c LAMP-1 (lysosomal-associated membrane protein 1) and corresponding image analysis (LAMP1-stained area in %), as well as d TMEM119 (homeostatic marker) and corresponding image analysis (TMEM119-stained area in %). Group sizes: n = 2-7 for all genotypes and timepoints. Data are shown as means ± SEM. WT: wild-type, TREM2-IPD: TREM2 cleavage-reduced, TREM2-sol: TREM2 soluble-only, TREM2-KO: TREM2 knockout. Ctrl: control food, cpz: cuprizone food for 5 weeks, rec: recovery on control food for 4 weeks. EC: external capsule. CC: corpus callosum. Scale bars: 300 µm (overview), 50 µm (close-up). Statistics: Holm–Sidak’s multiple comparison test one-way ANOVA (*p < 0.05, **p < 0.01, ***p < 0.001, ****p < 0.0001). Comparisons not indicated are non-significant. wt ctrl1, wt cpz1 and wt rec1 are the respective wild-type groups for the study with TREM2-IPD and TREM2-sol, wt ctrl2, wt cpz2 and wt rec2 are the wild-type groups for the TREM2-KO study. Only statistical analysis within a study was performed. For d the analysis of the respective wt group for TREM2-KO was omitted as no relevant TMEM119 signal was observed

