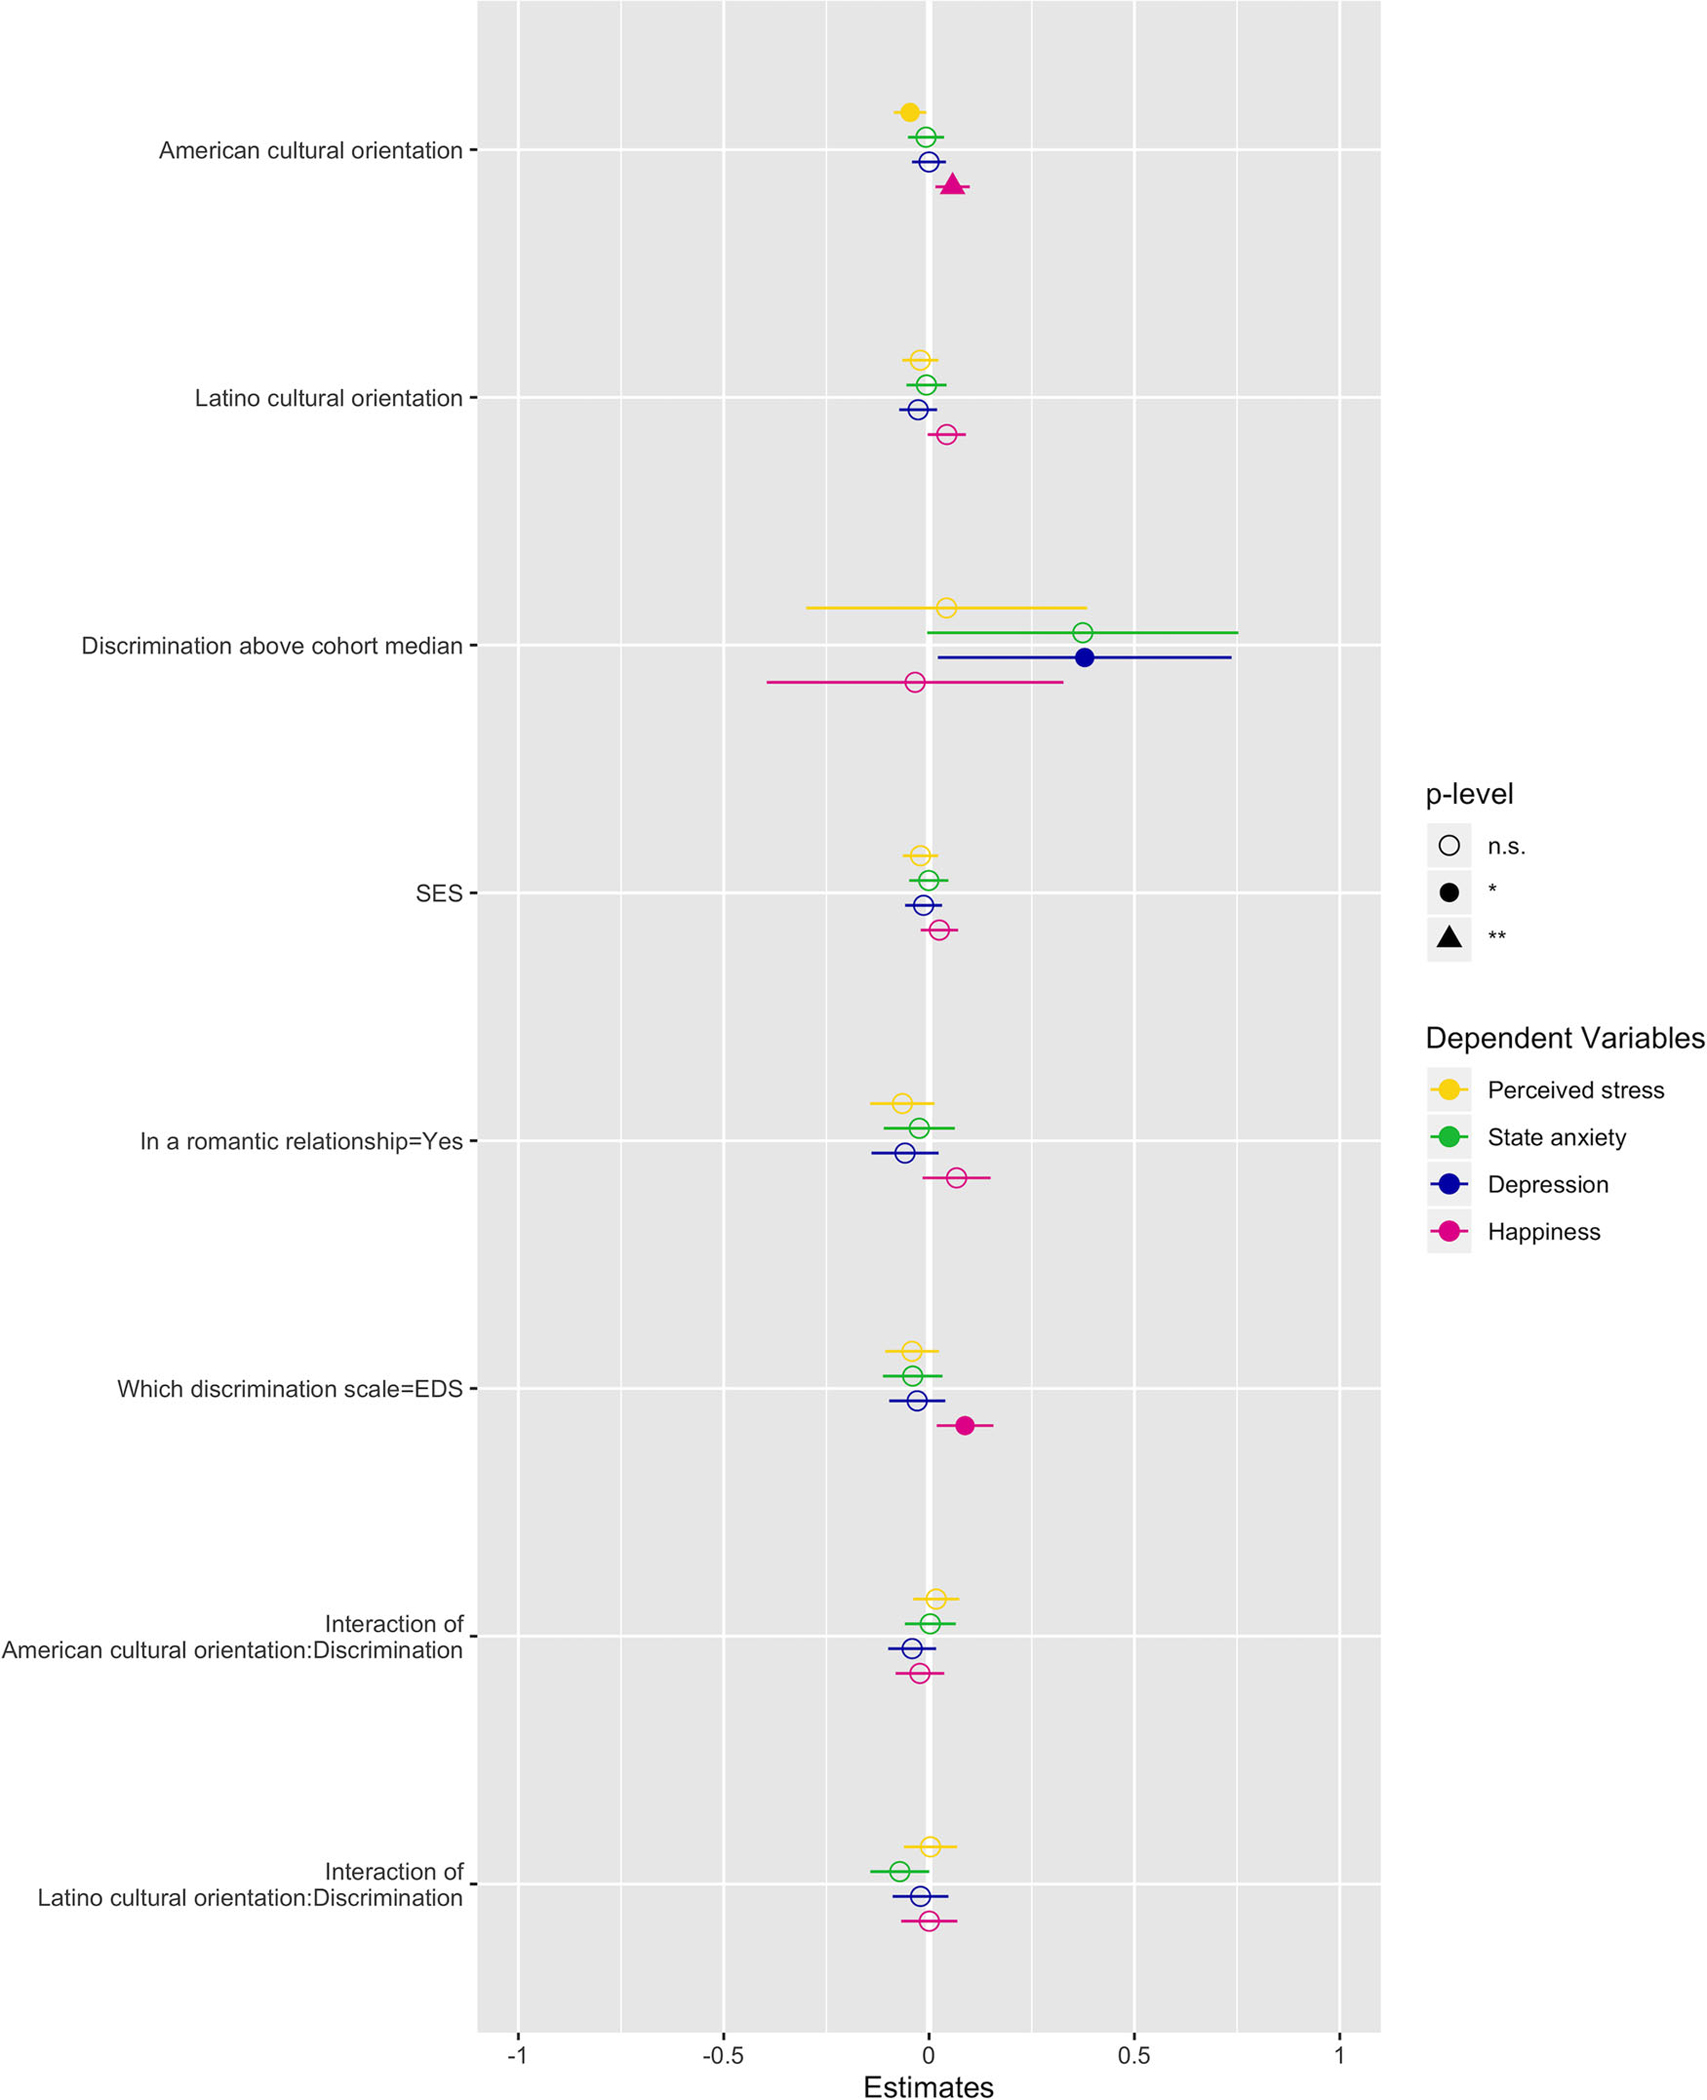
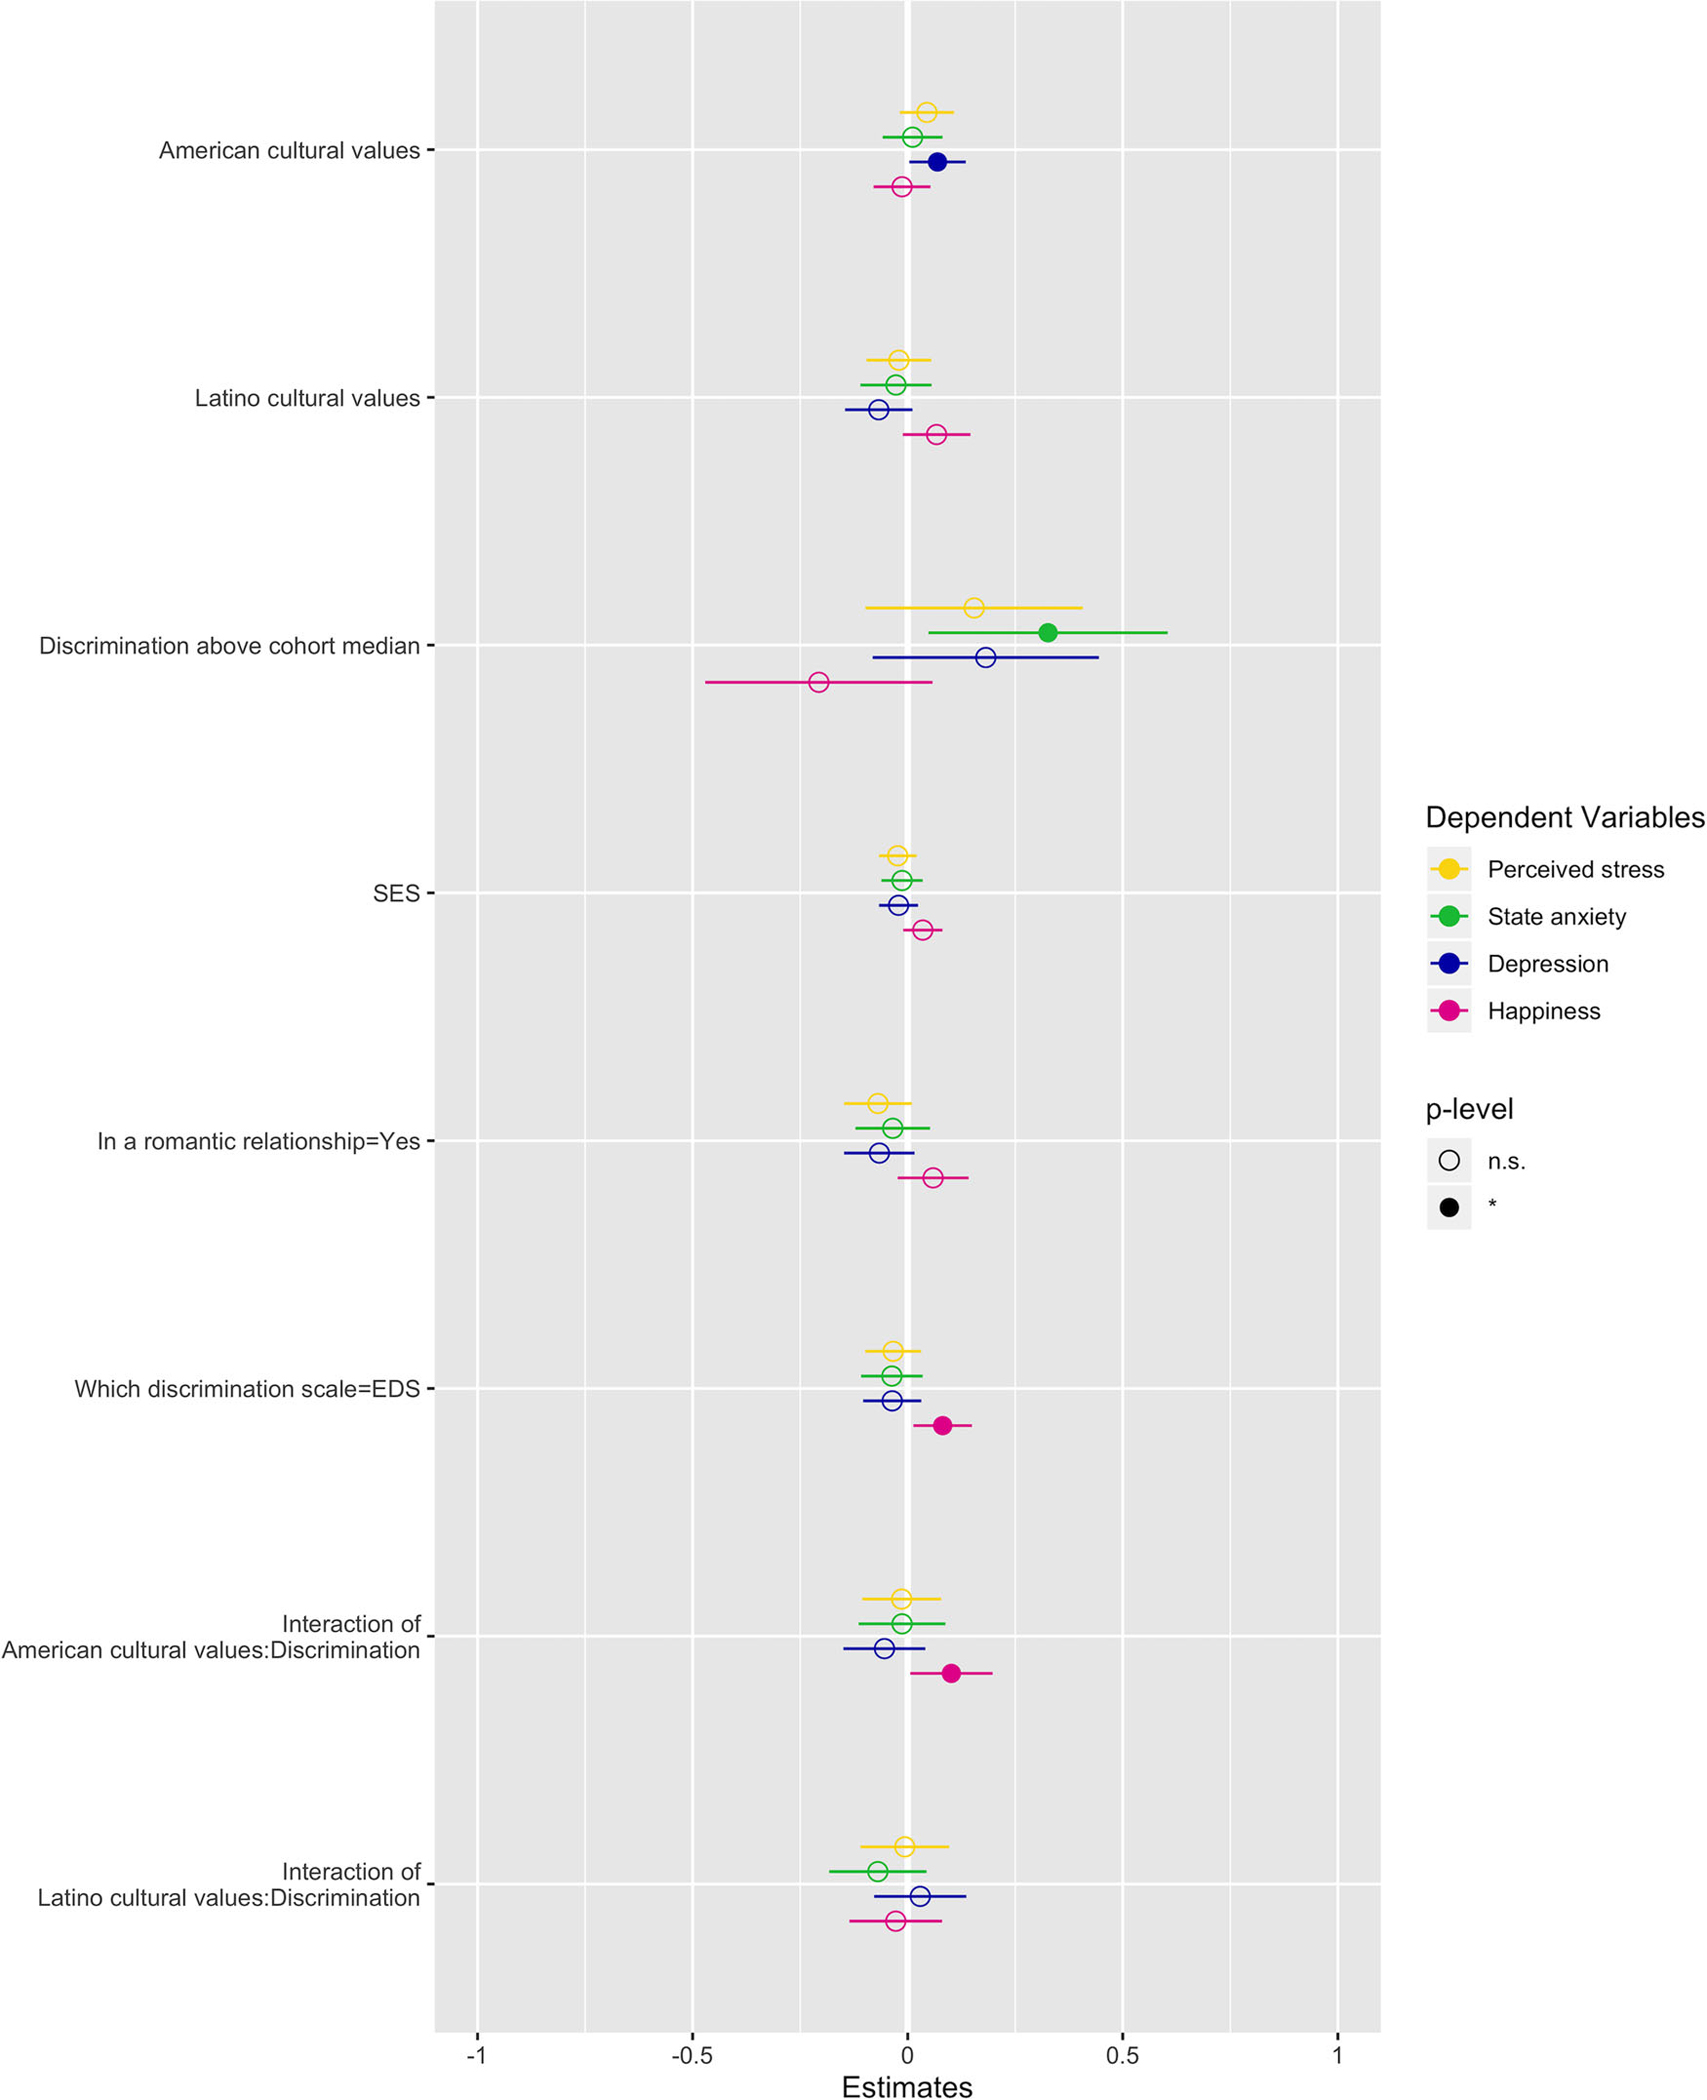
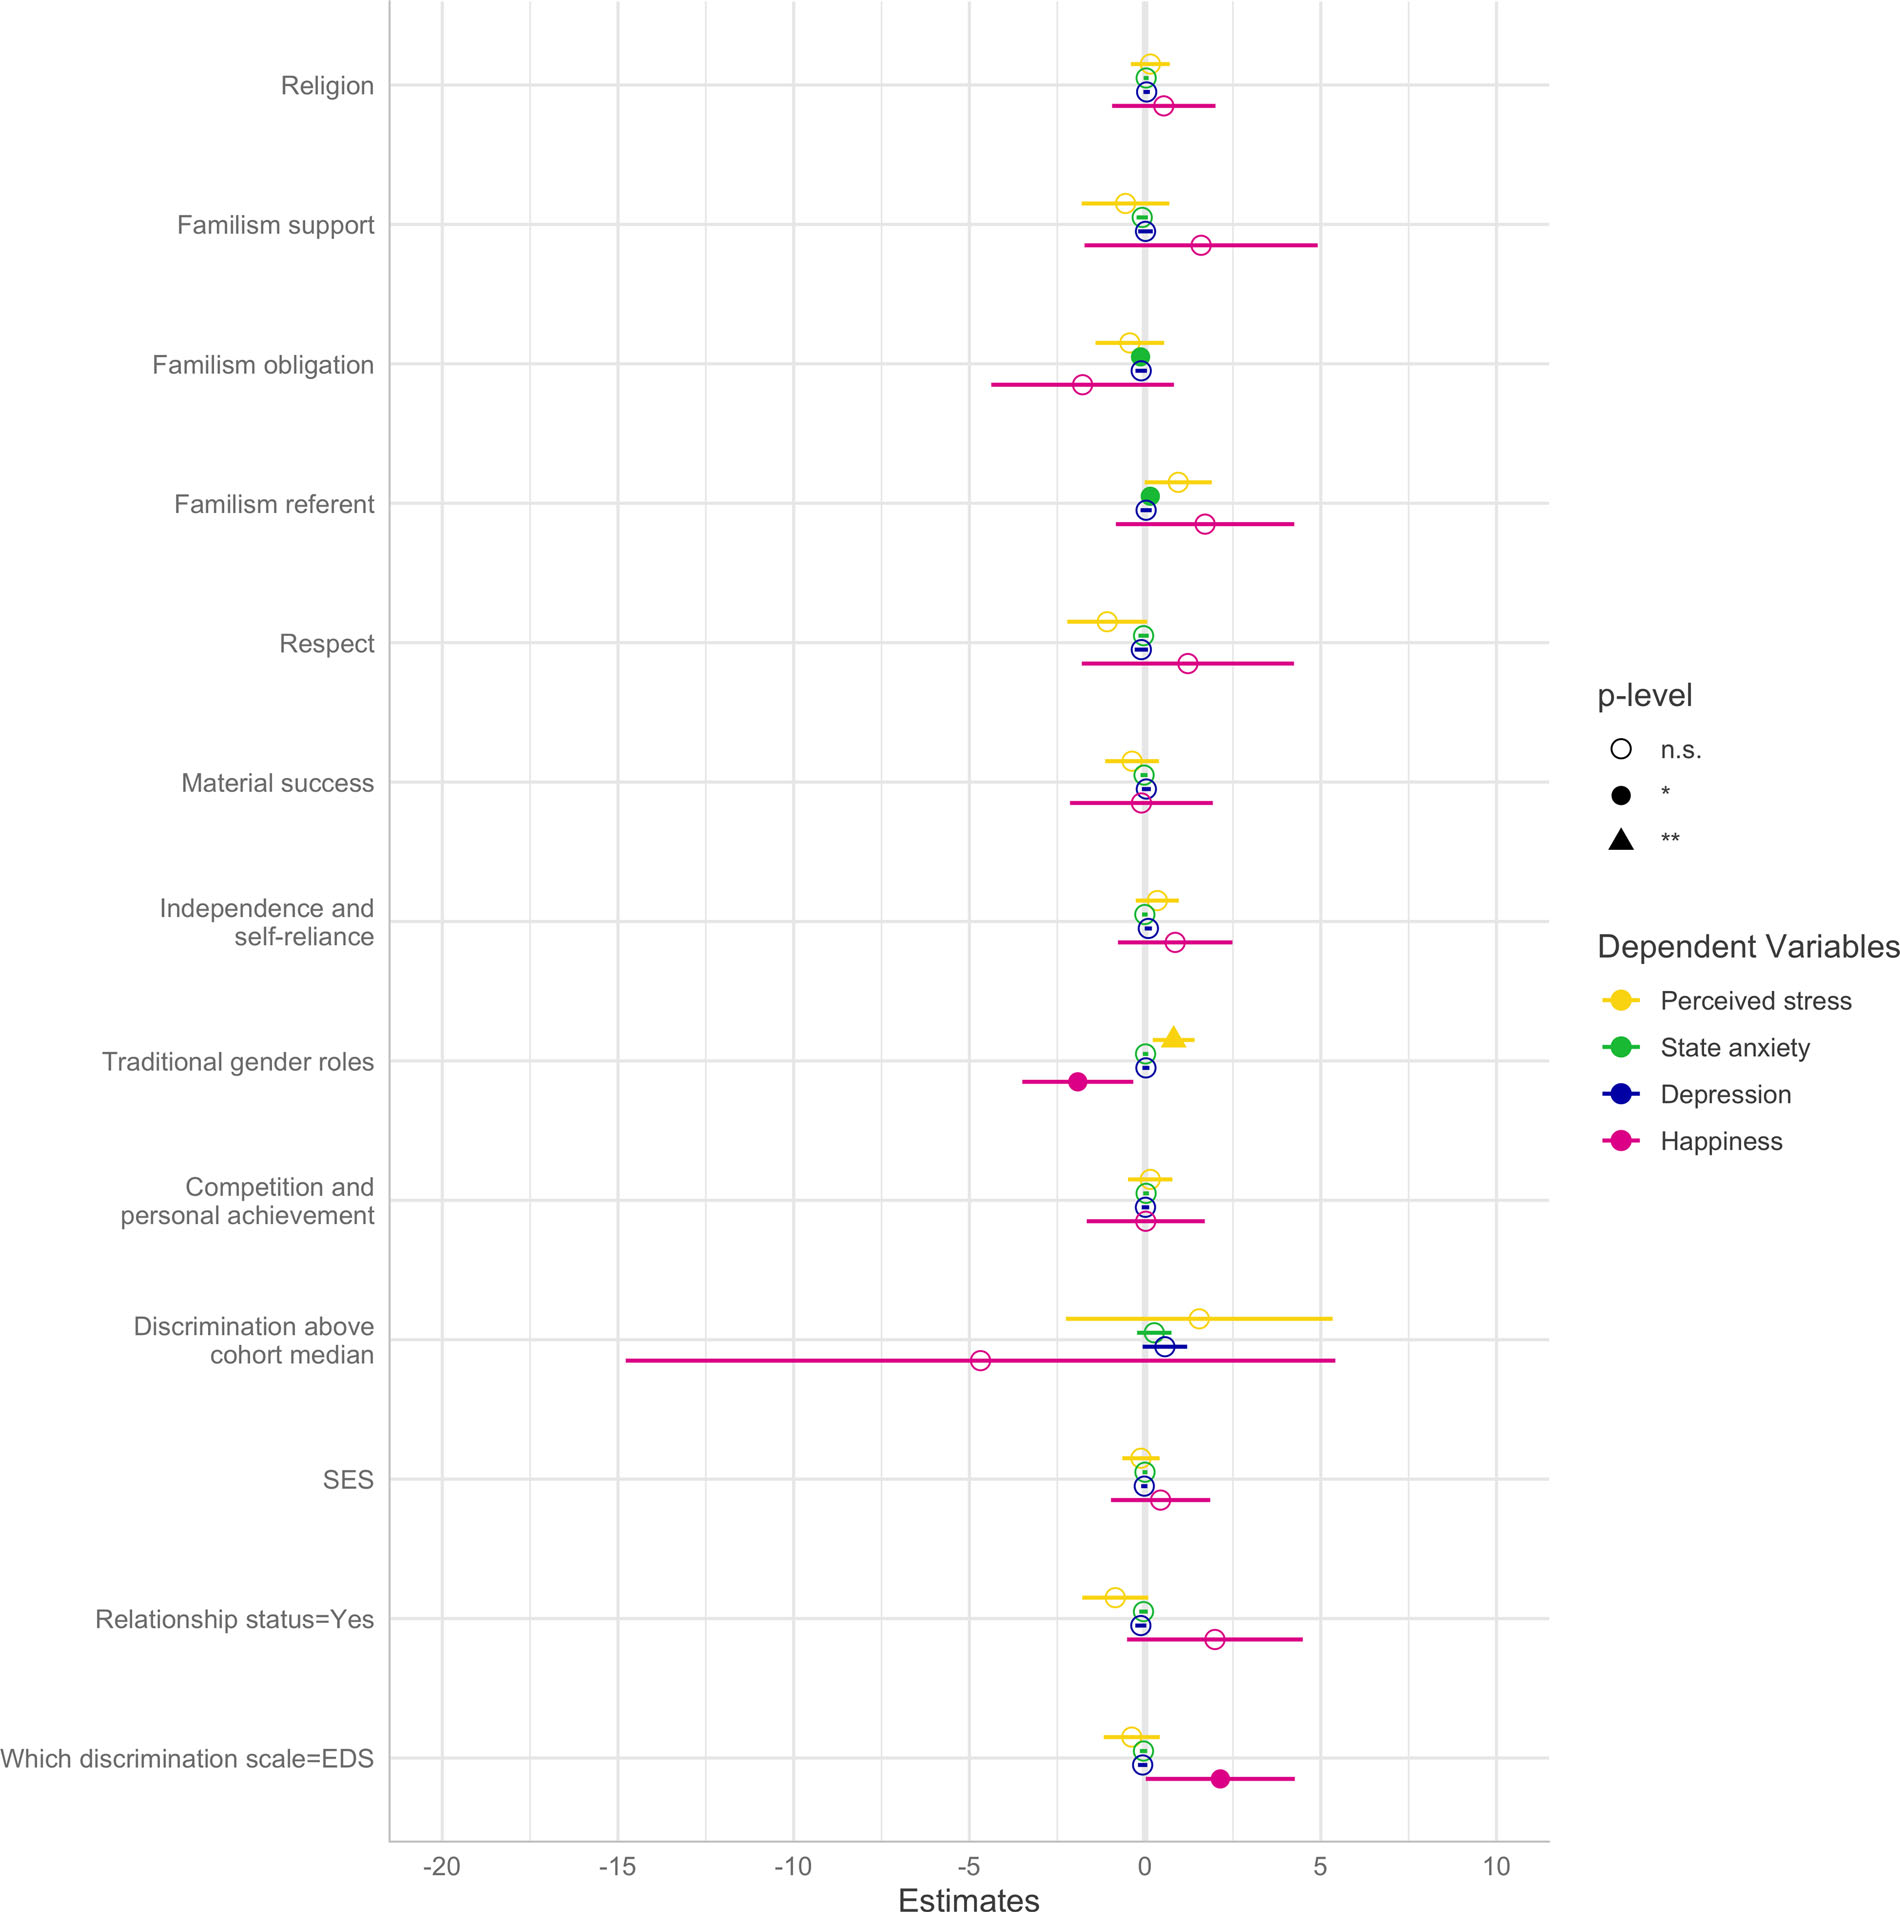
FIGURE 1.


Marginal effects of coefficients for multiple regression models. Visualizations of the coefficients and p-values for the four mental health outcome models using (A) cultural orientation, (B) cultural values systems, and (C) cultural values items as predictors, in addition to control variables. For visualization purposes only, dependent variables were normalized by unitization with zero minimum in order to plot effect sizes together. Numeric information and model fitting statistics are in Tables 2–4.
