
Extended Data Fig. 3 |.
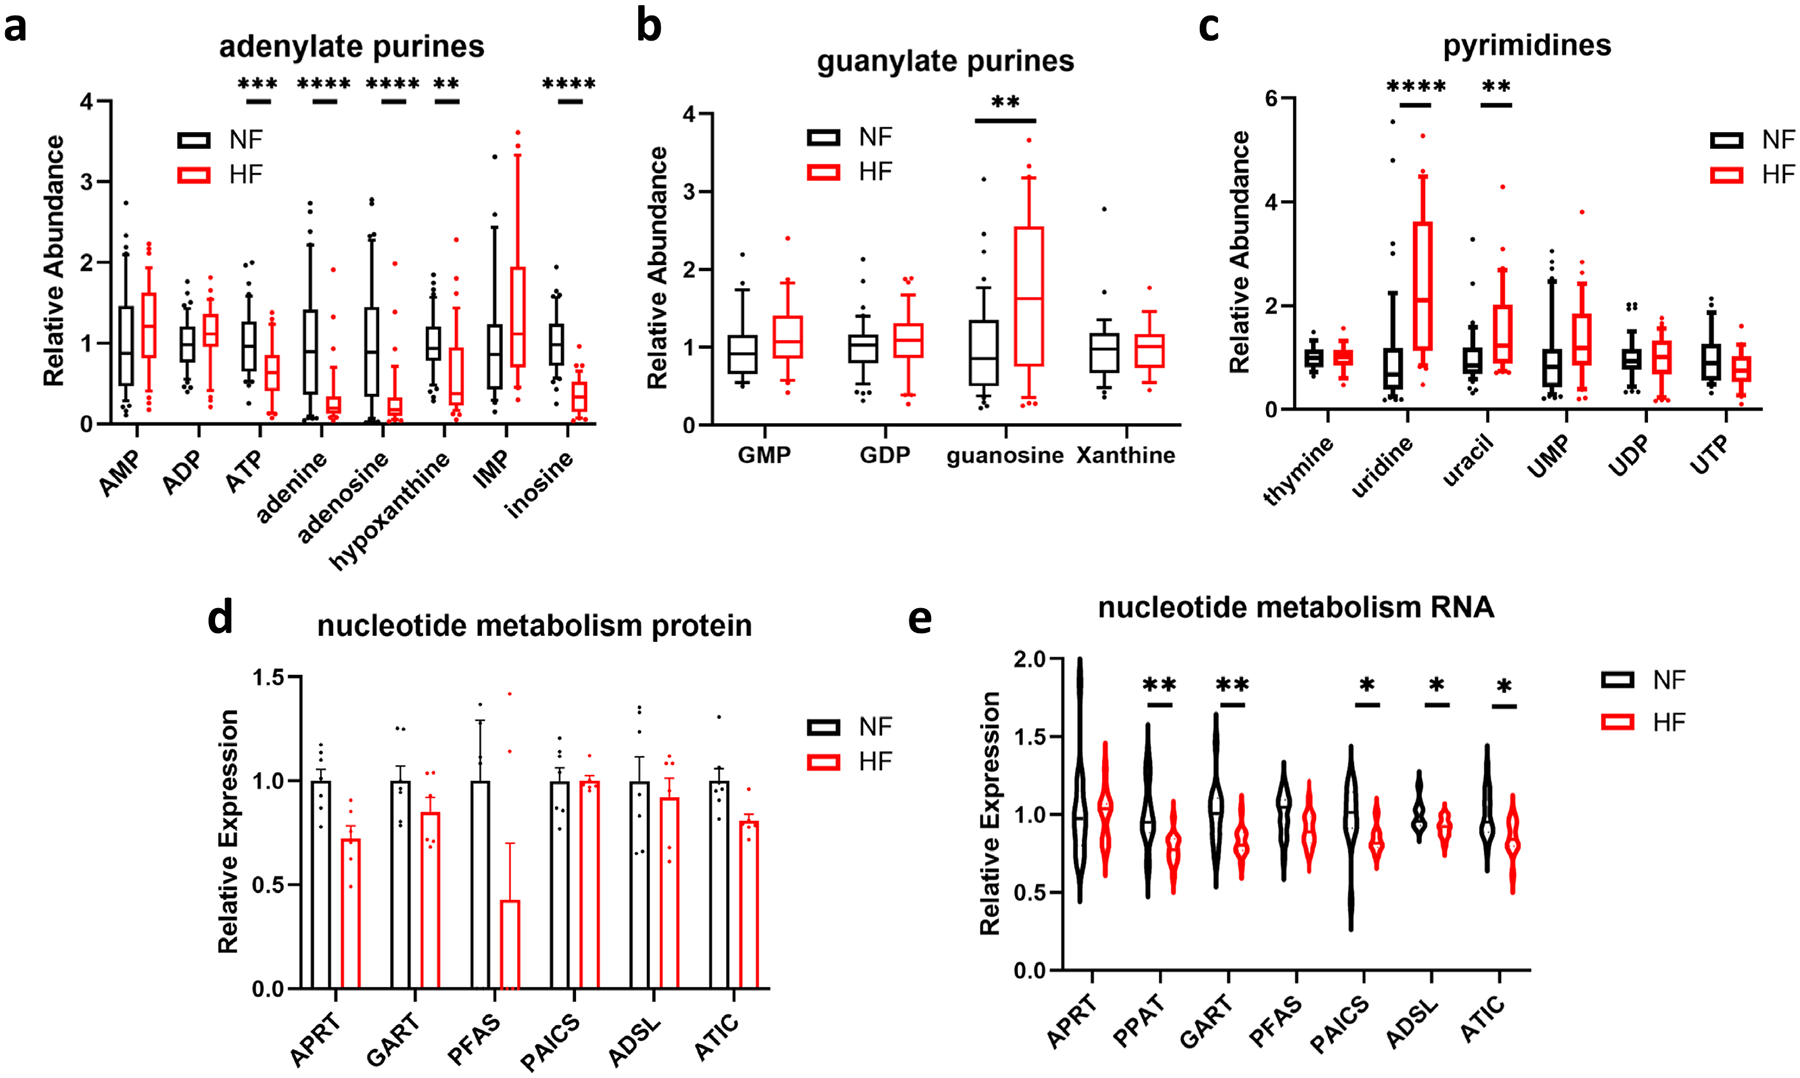
a-c) Relative abundance of metabolites involved in adenylate (a), guanylate (b), or pyrimidine (c) metabolism in cardiac tissue from nonfailing donors (NF) or subjects with heart failure (HF). Whiskers represent 10th and 90th percentiles, midline represents median, edges of boxes represent first and third quartiles, and points represent data points outside the 10th-90th percentile range. N = 48 NF and N = 39 HF samples. ATP FDR = 0.000904; adenine FDR = 1.09E-05; adenosine FDR = 1.4E-05; hypoxanthine FDR = 0.00126; inosine FDR = 3.02E-13; guanosine FDR = 0.00227; uracil FDR = 0.00202; uridine FDR = 1.09E-05. d-e) Relative protein (d) and mRNA (e) expression of enzymes involved in nucleotide metabolism. Bars represent mean and standard error (N = 7 NF and N = 6 HF). RNA: PPAT FDR = 0.00425; GART FDR = 0.00967; PAICS FDR = 0.0292; ADSL FDR = 0.0204; ATIC FDR = 0.0144. *P < 0.05, **P < 0.01, ***P < 0.001, ****P < 0.0001. P-values were determined by FDR-corrected two-tailed t-test.