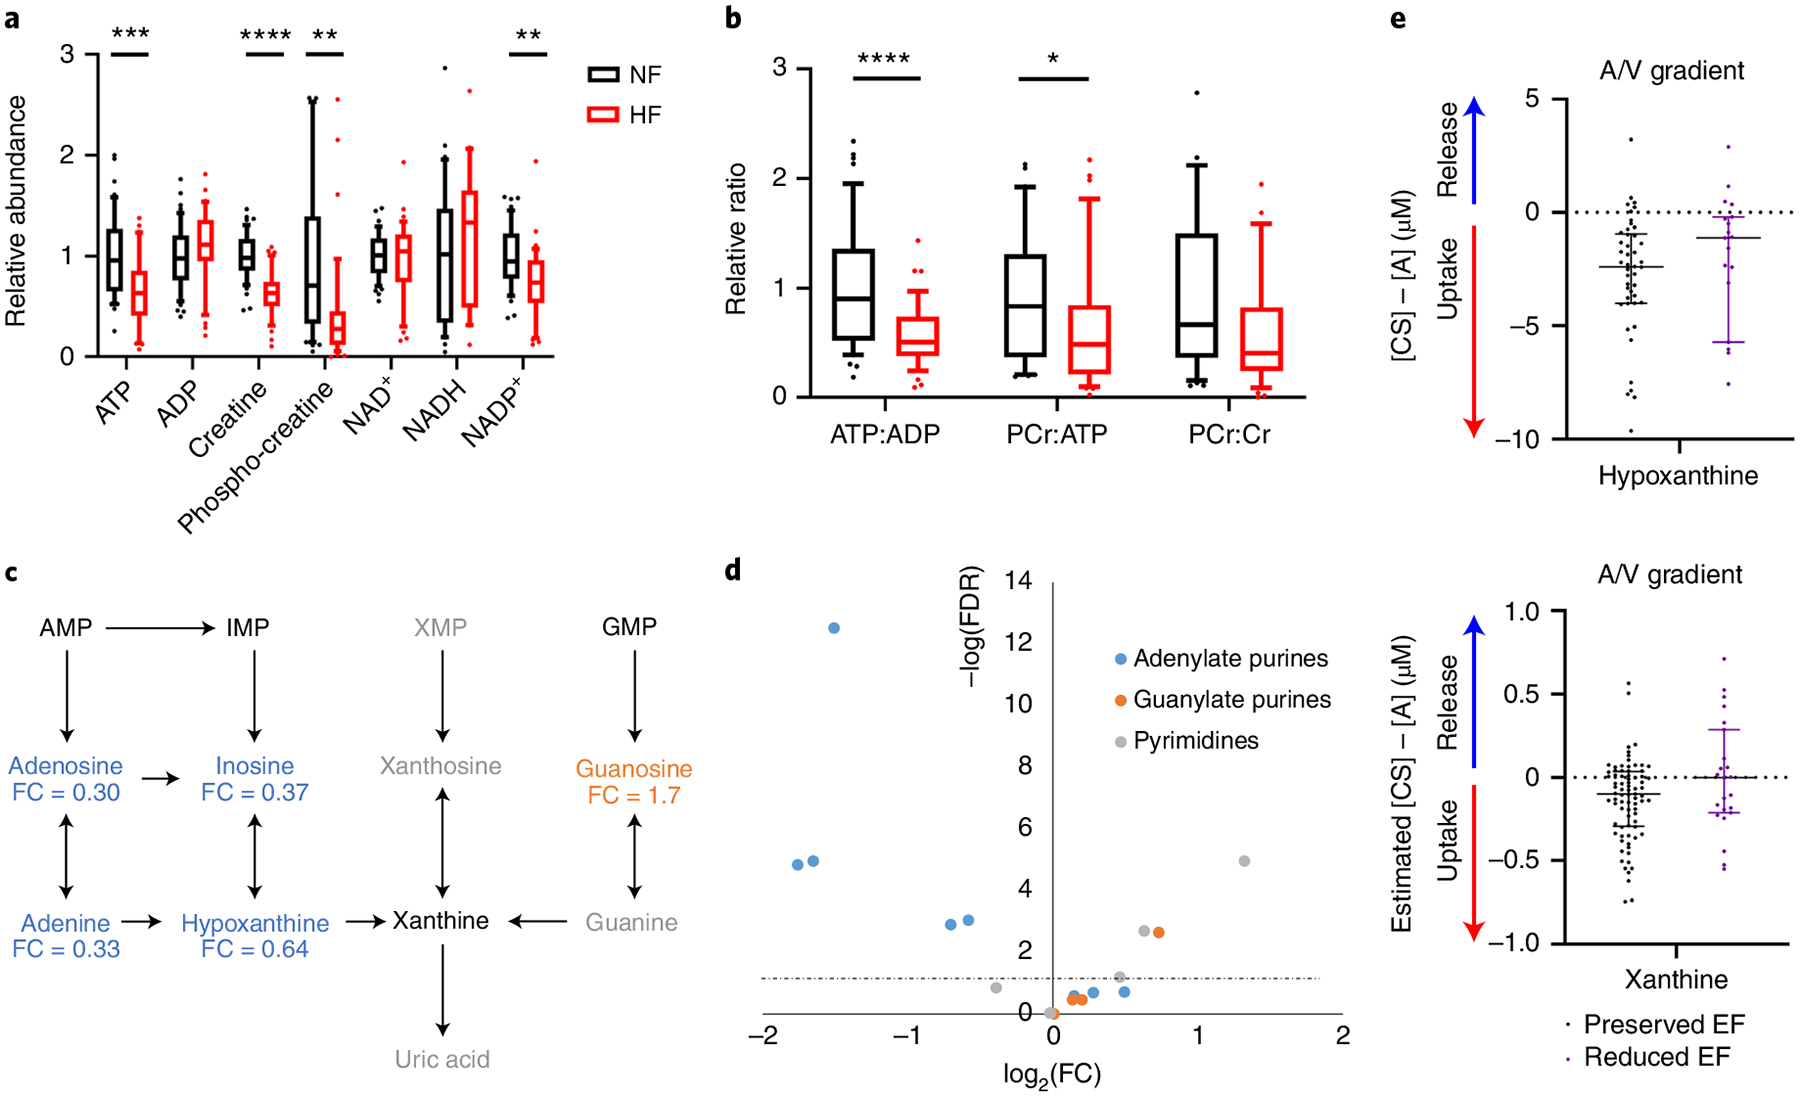
Fig. 2 |. Loss of adenylate purines and high-energy phosphate molecules in HF.

a,b, Relative abundance (a) and ratios (b) of metabolites involved in high-energy phosphate transfers in cardiac tissue from NF donors (n = 48) or subjects with HF (n = 39). The whiskers represent the 10th and 90th percentiles, the midline represents the median, the edges of boxes represent the first and third quartiles and points represent data points outside the 10th–90th percentile range. *P < 0.05, **P < 0.01, ***P < 0.001, ****P < 0.0001. FDR-corrected (a) or nominal (b) P values were determined by two-tailed Student’s t-test. (ATP FDR = 0.000904; ADP FDR = 0.258; creatine FDR = 7.01 × 10⁻⁹; PCr FDR = 0.00268; NAD+ FDR = 0.787; NADH FDR = 0.463; NADP+ FDR = 0.00167; ATP:ADP P = 1.9 × 10⁻⁵; PCr:ATP P = 0.0458; PCr:Cr P = 0.0556). c, Purine degradation pathway. Blue text indicates significantly reduced in failing cardiac tissue and orange significantly elevated in failing cardiac tissue. Fold-change is indicated below each metabolite. Gray text indicates not detected. Significance based on FDR-corrected, two-tailed Student’s t-test (n = 48 NF and n = 39 HF samples). d, Volcano plot of nucleotides, nucleosides, bases and their intermediates from all tissue samples. Fold-change was calculated as the average for NF samples divided by the average of failing samples. P values are FDR-corrected, two-tailed Student’s t-test. The dotted line represents the threshold of statistical significance. A/V, arteriovenous. e, Transcoronary gradient concentrations (artery to coronary sinus) of hypoxanthine and xanthine in human patients with preserved (n = 81) versus reduced (n = 23) EF. Negative values indicate uptake of metabolite into the heart and positive values indicate release of metabolite from the heart. The lines represent the median and interquartile range (IQR). Two outliers in each graph are not shown. AMP, adenosine monophosphate; IMP, inosine monophosphate; XMP, xanthosine monophosphate; GMP, guanosine monophosphate.
