
Fig. 3 |. Evidence of defective FA transport and FAO in failing hearts.
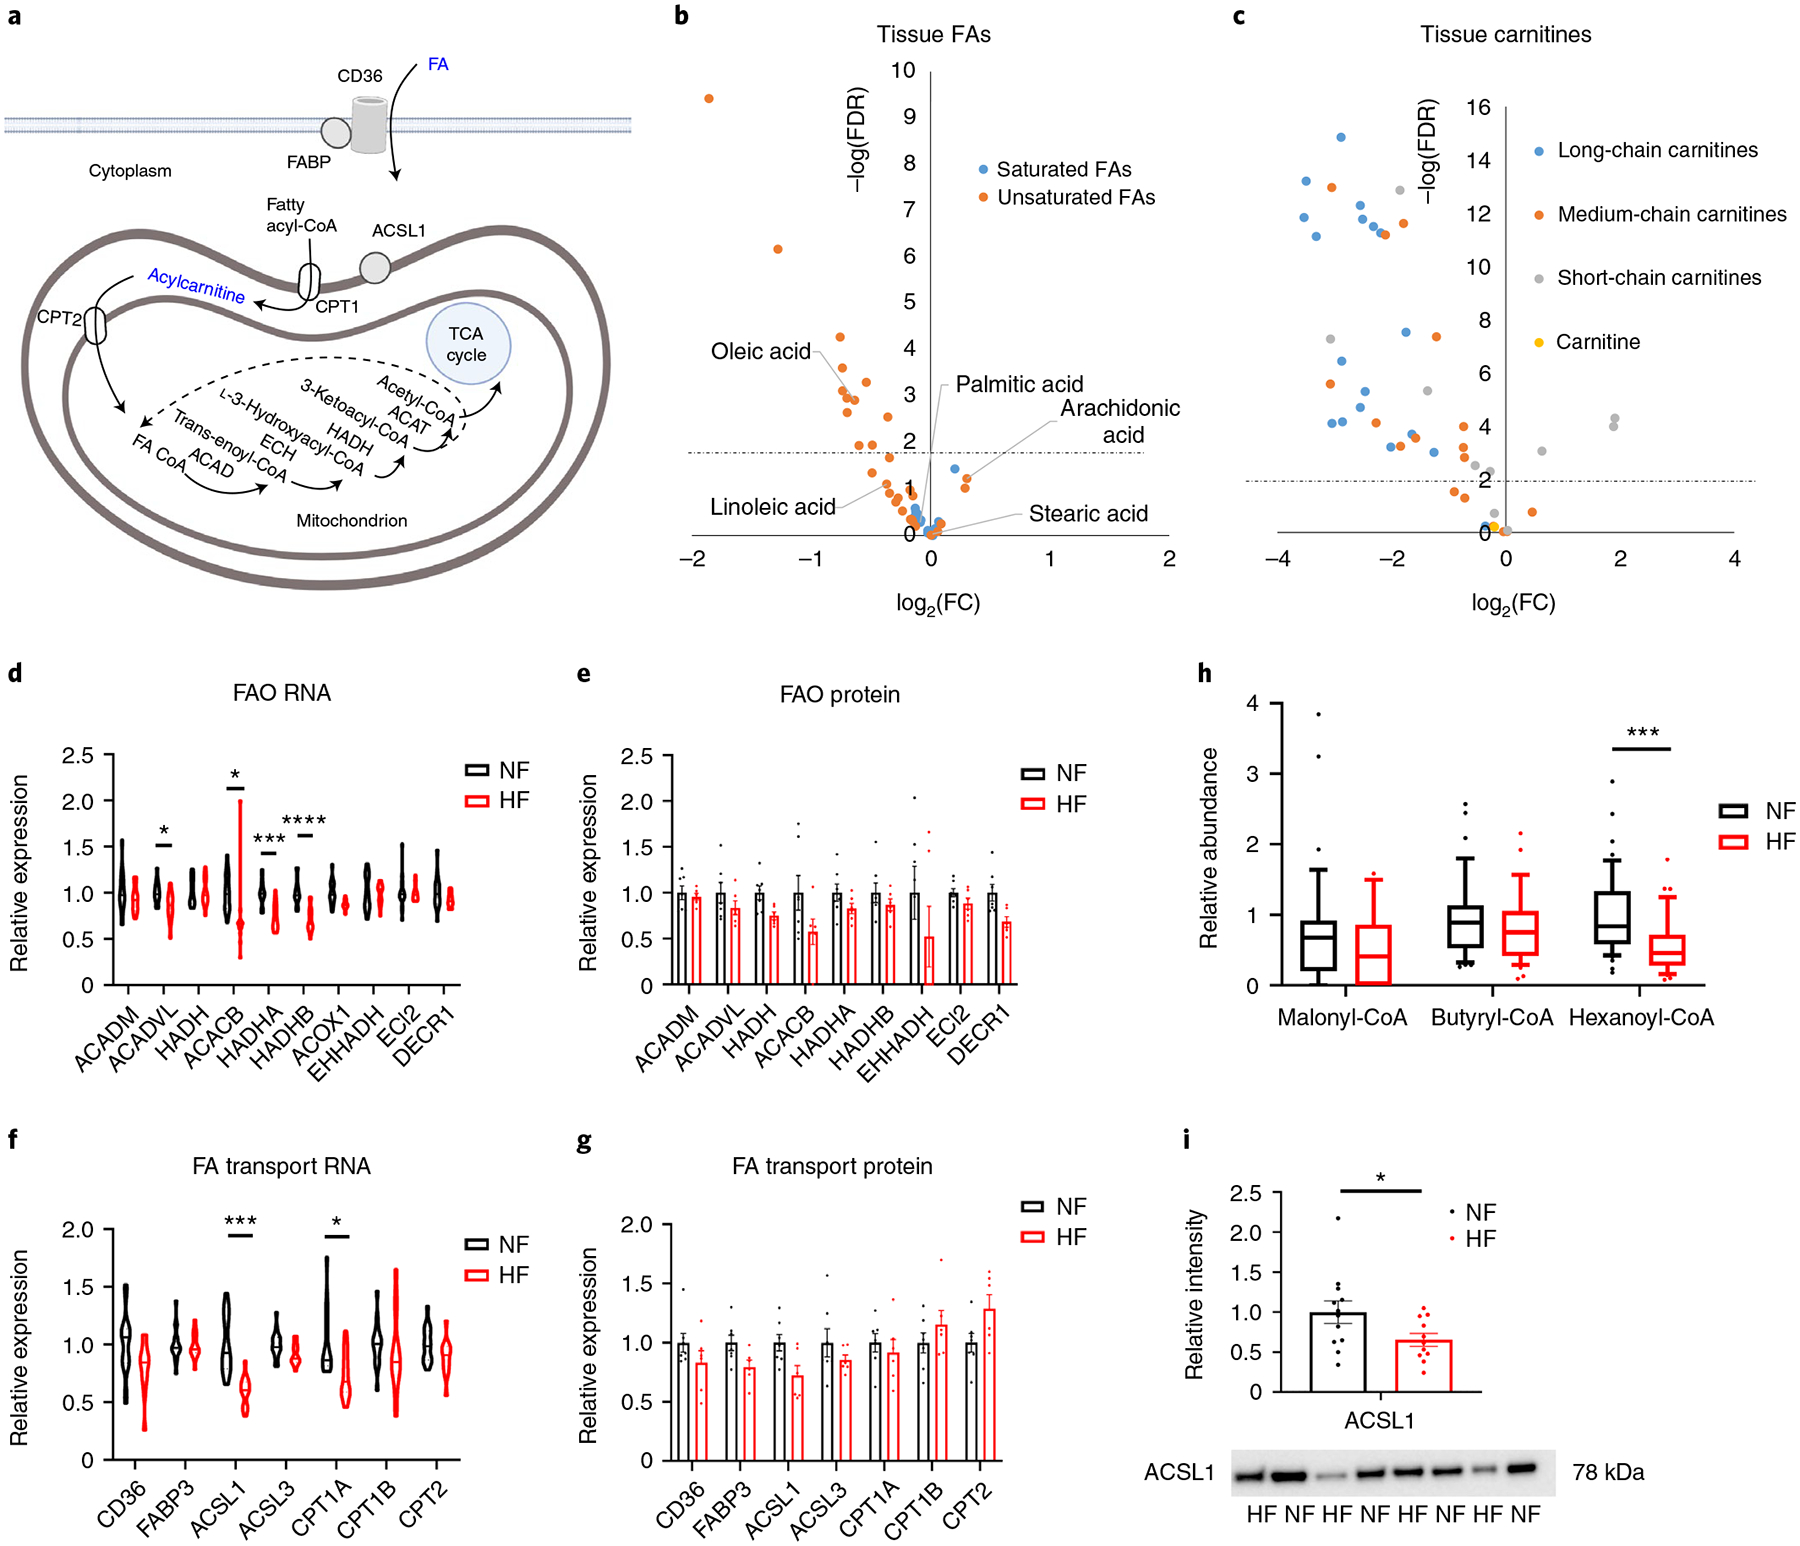
a, Schematic of FA import and FAO. Blue text indicates a molecule or family of molecules that is reduced in HF. Created with BioRender.com FABP, FA-binding protein. b,c, Volcano plot of differences in FA (b) or carnitine (c) abundance in cardiac tissue, comparing nonfailing (NF) with failing (HF) samples. d,e, Relative mRNA (d) and protein (e) expression of FAO genes. Bars represent mean and s.e.m. (n = 7 NF and n = 6 HF). Significant P values from d are as follows: ACADVL FDR = 0.0194; ACACB FDR = 0.0433; HADHA FDR = 0.000164; HADHB FDR = 4.2 × 10⁻⁵. f,g, Relative mRNA (f) and protein (g) expression of FA transport genes. Bars represent mean and s.e.m. (n = 7 NF and n = 6 HF). Significant P values for f are as follows: ACSL1 FDR = 0.000114; CPT1A FDR = 0.0194. h, Relative abundance of indicated coenzyme A species in tissue samples (n = 47 NF and n = 35 HF). The whiskers represent the 10th and 90th percentiles, the midline represents the median, the edges of boxes represent the first and third quartiles and the points represent data points outside the 10th–90th percentile range. Hexanoyl-CoA P = 0.000183. i, Quantification of ACSL1 protein by western blotting, with representative image of eight failing and NF tissues, shown below (see Extended Data Fig. 4 for full blot). Bars represent mean and s.e.m. (n = 12 NF and n = 11 HF). ACSL1 western blot P = 0.0475. *P < 0.05, **P < 0.01, ***P < 0.001, ****P < 0.0001. P values were determined by FDR-corrected, two-tailed Student’s t-test, except h, which uses a nominal P value.