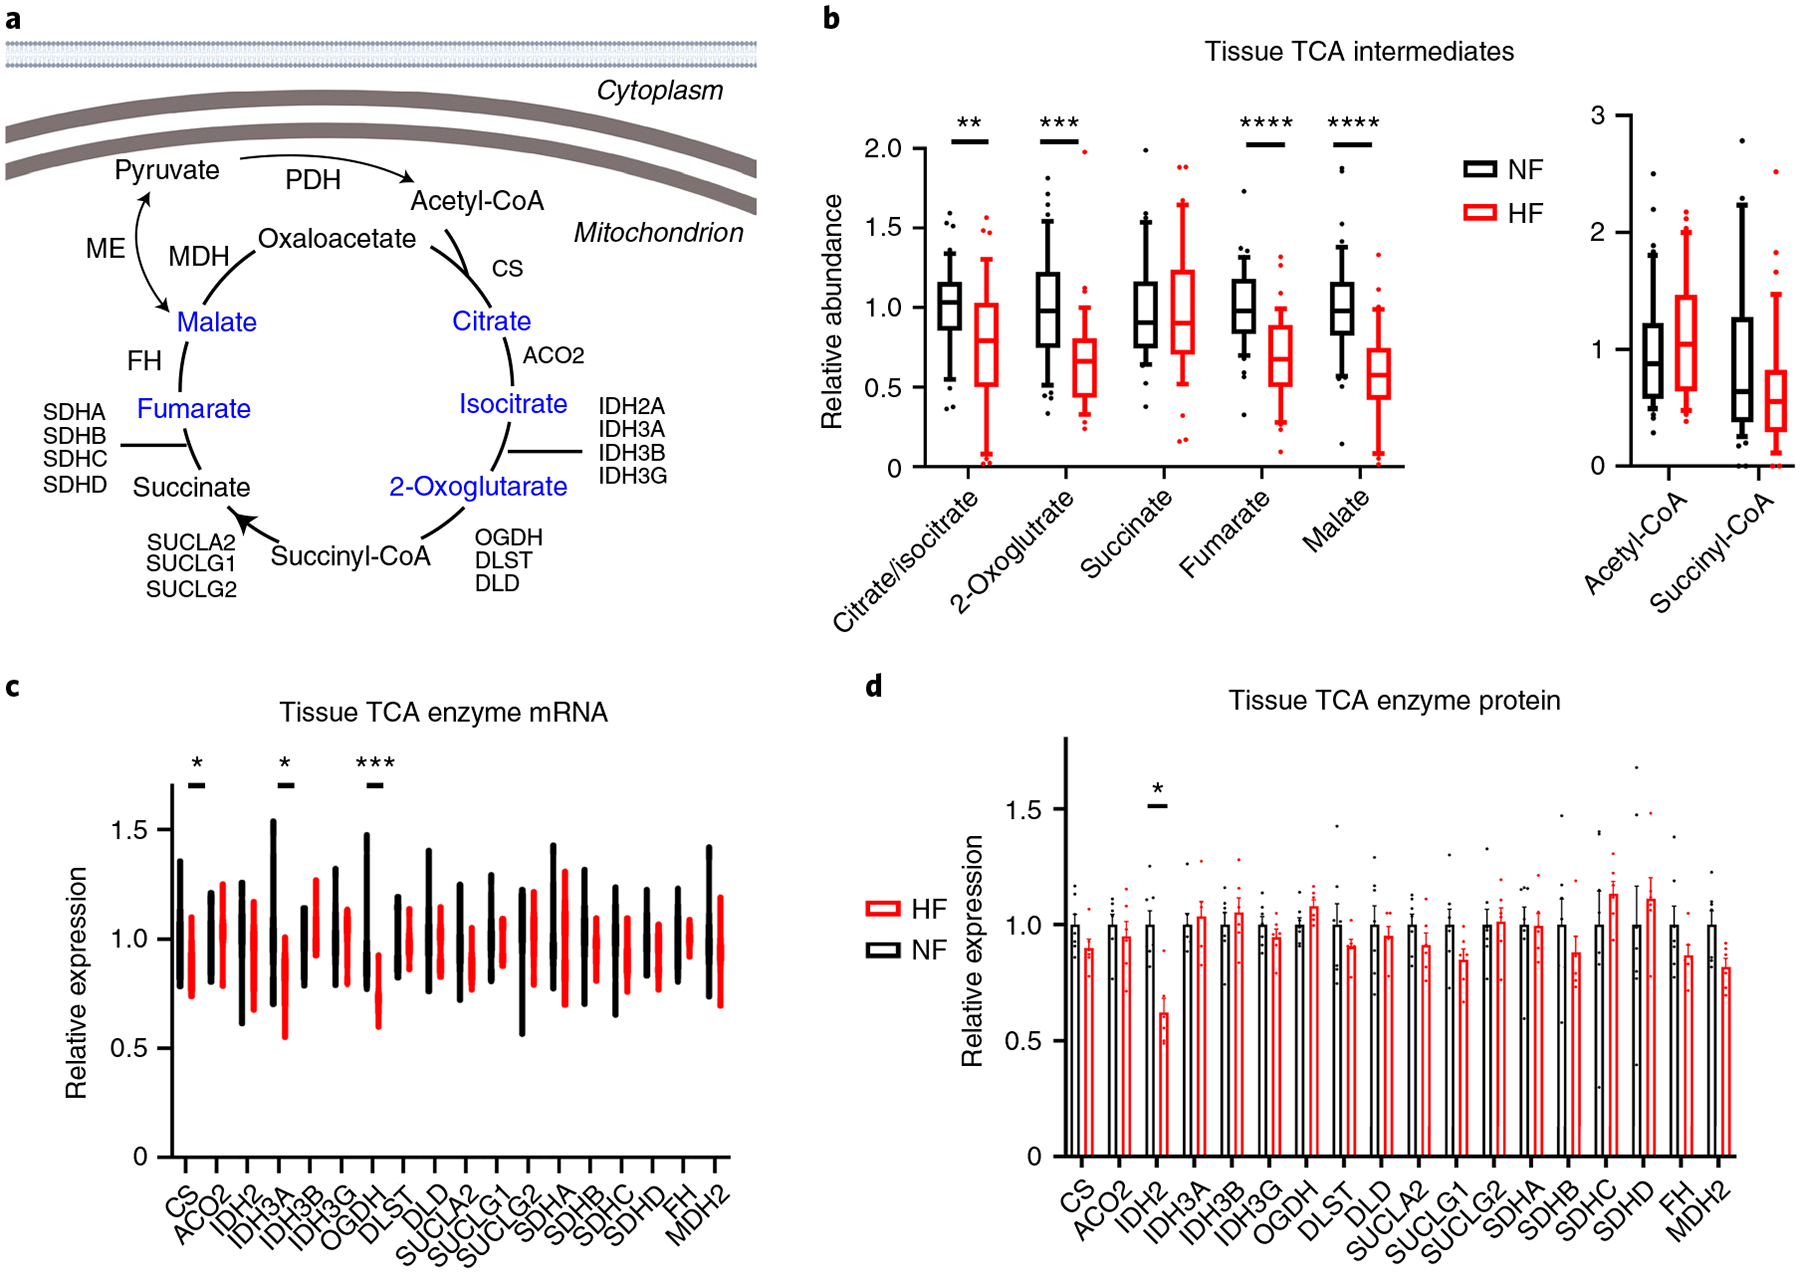
Fig. 5 |. Evidence of depressed cardiac anaplerosis and TCA cycle in failing hearts.

a, Schematic of the TCA cycle. Blue text indicates a metabolite that is significantly reduced in failing hearts. Created with BioRender.com b, Relative abundance of TCA intermediates and indicated coenzyme A species in cardiac tissues. The whiskers represent 10th and 90th percentiles, the midline represents the median, the edges of boxes represent the first and third quartiles and the points represent data points outside the 10th–90th percentile range (n = 48 NF and n = 39 HF samples for non-coenzyme A metabolites (left) and n = 47 NF and N = 35 HF for CoA metabolites (right)). Citrate/isocitrate FDR = 0.00671; 2-oxoglutarate FDR = 0.000179; fumarate FDR = 2.74 × 10⁻⁶; malate FDR = 2.66 × 10⁻⁷. c,d, Relative RNA (c) and protein (d) expression of TCA enzymes. Bars represent mean and s.e.m. (n = 7 NF and n = 6 HF). RNA: CS FDR = 0.0462; IDH3A FDR = 0.020; OGDH FDR = 0.000232. Protein: IDH2 FDR = 0.0217. *P < 0.05, **P < 0.01, ***P < 0.001, ****P < 0.0001. P values were determined by FDR-corrected, two-tailed Student’s t-test.
