
Fig. 8 |. Decreased ceramides and elevated LPLs in failing hearts.
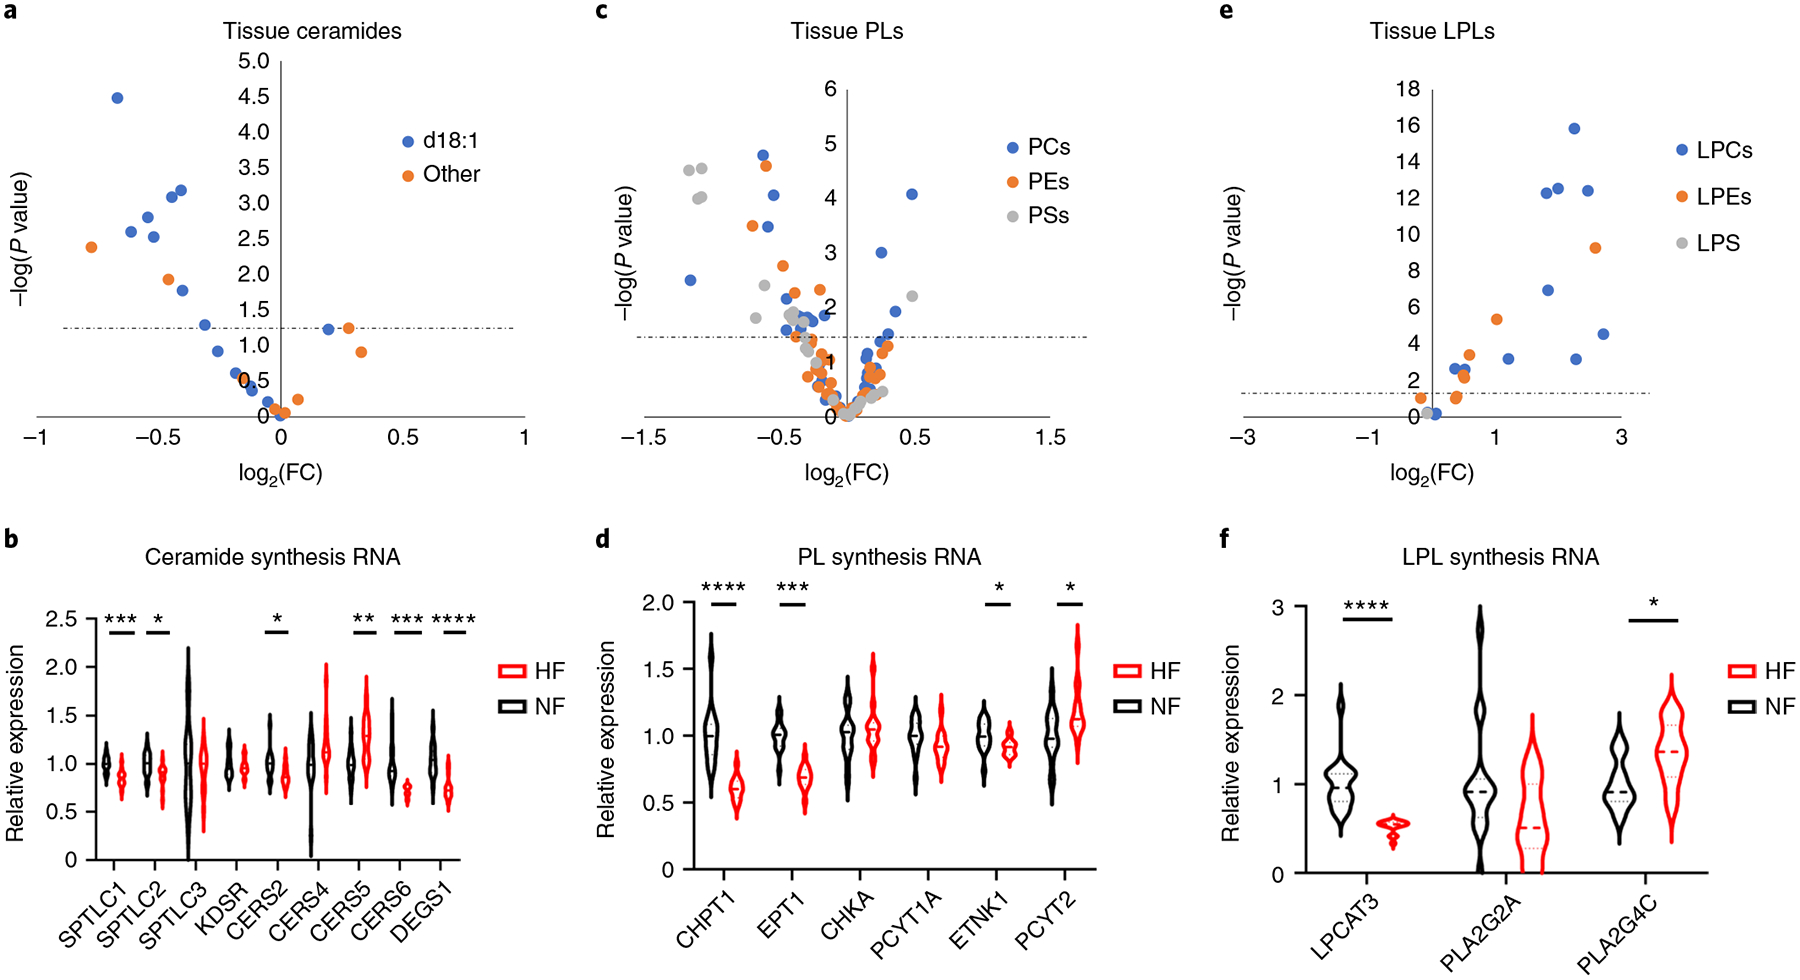
a, Volcano plot of differences in ceramide abundance in cardiac tissue, comparing nonfailing with failing samples. b, Relative mRNA expression of ceramide synthesis enzymes. SPTLC1 FDR = 0.000282; SPTLC2 FDR = 0.0228; CERS2 FDR = 0.0281; CERS5 FDR = 0.00122; CERS6 FDR = 0.000149; DEGS1 FDR = 5.70 × 10⁻⁵. c, Volcano plot of differences in PL abundance in cardiac tissue, comparing nonfailing with failing samples. d, Relative mRNA expression of PL synthesis enzymes. CHPT1 FDR = 1.17 × 10⁻⁵; EPT1 FDR = 5.41 × 10⁻⁷; ETNK1 FDR = 0.0467; PCYT2 FDR = 0.0308. e, Volcano plot of differences in LPL abundance in cardiac tissue, comparing nonfailing with failing samples. f, Relative mRNA expression of LPL synthesis enzymes. LPCAT3 FDR = 4.53 × 10⁻⁵; PLA2G4C FDR = 0.0159. The dotted line represents the threshold of statistical significance (FDR corrected). *P < 0.05, **P < 0.01, ***P < 0.001, ****P < 0.0001. P values were determined by FDR-corrected, two-tailed Student’s t-test.