Figure 2.

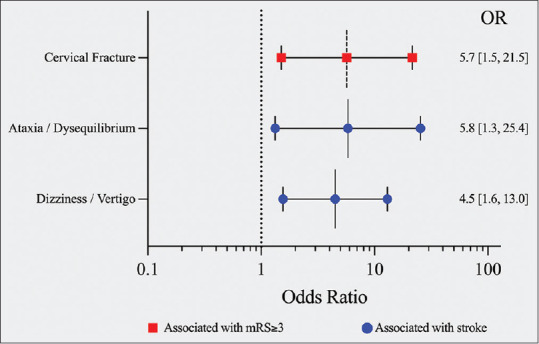
Forest plot demonstrating the odds ratios from multivariable analysis to identify factors independently associated with mRS ≥3 at discharge (red), and factors independently associated with stroke (blue). mRS - Modified Rankin Scale

Forest plot demonstrating the odds ratios from multivariable analysis to identify factors independently associated with mRS ≥3 at discharge (red), and factors independently associated with stroke (blue). mRS - Modified Rankin Scale