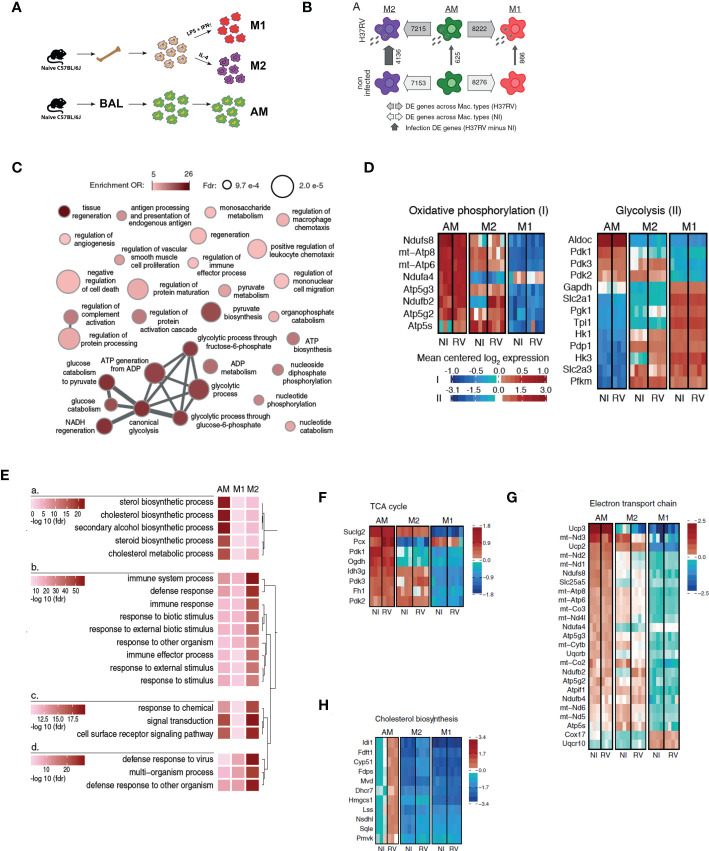
Figure 1.
Alveolar macrophages have a highly divergent transcriptomic profile with respect to either M1 or M2 macrophages. (A) Bone marrow was harvested from naïve C57BL/6J mice and cultured in the presence of L929-conditioned media for 6 days prior to polarization with either LPS and IFNγ (M1), or IL-4 (M2) for 24hrs. Alternatively, alveolar macrophages (AM) were harvested from BAL of naïve mice. Cells were infected with Mtb H37Rv (MOI=1) for 24 hours. (AM n=3 biological replicates, M1/M2 BMDM n=4 biological replicates). (B) Numbers of differentially expressed genes between macrophage types and infection states (at 5% FDR, see also Table S1 ). (C) Network visualization of the GO terms most significantly enriched among genes showing a significantly lower expression in AM than in M1 non-infected macrophages (see also Table S2 ). Node size is proportional to its statistical significance (all nodes show an FDR<1x10⁻³), while color illustrates enrichment’s effect size (OR>5) and connections indicate semantic similarity between terms (i.e. genes shared). (D) Expression heatmaps for genes annotated within the metabolic pathways “Oxidative phosphorylation” and “glycolysis” in www.wikipathways.org. Only genes showing most significant differential expression changes with respect to any of the contrasts presented in Table S1 were plotted (FDR < 0.05 and abs(logFC)>1). (E) Comparative enrichment results for the GO terms most significantly enriched among genes up-regulated upon H37RV infection in the three types of macrophages. (F–H) Expression heatmaps for genes annotated within the metabolic pathways “TCA cycle” (F), “Electron transport chain” (G) and “Cholesterol biosynthesis” (H) in www.wikipathways.org. Only genes showing most significant differential expression changes with respect to any of the contrasts presented in Table S1 were plotted (FDR < 0.05 and abs(logFC)>1).

