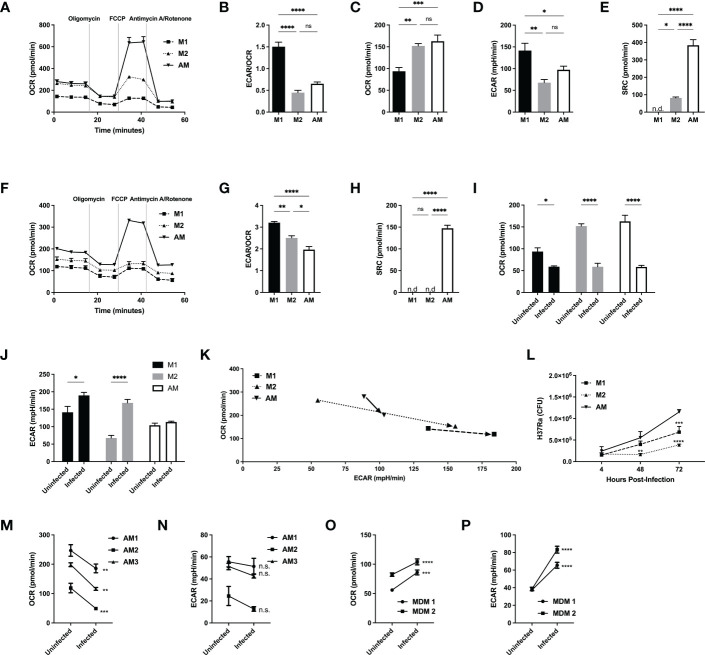
Figure 2.
Alveolar macrophages have a unique metabolic signature, distinct from M2 macrophages and do not switch to a glycolytic phenotype following avirulent (H37Ra) Mtb infection. M1 and M2 bone marrow-derived and naïve alveolar macrophages were subjected to a Seahorse assay to measure cellular metabolism before (A–E) and after 24hrs of infection (F–K) with H37Ra at MOI of 2.5. (A) Oxygen consumption rate (OCR) curve following sequential injections of mitochondrial inhibitors oligomycin, FCCP and antimycin/rotenone (Ant Rot). (B) Ratio of extracellular acidification rate (ECAR)/OCR. (C) Quantification of basal levels of oxygen consumption, (D) ECAR, (E) spare respiratory capacity (SRC). (F) Oxygen consumption rate (OCR) curve of infected macrophages following sequential injections of mitochondrial inhibitors oligomycin, FCCP and antimycin/rotenone. (G) Ratio of ECAR/OCR of infected macrophages. (H) Quantification of spare respiratory capacity of infected macrophages. Shift in (I) OCR and (J) ECAR following infection, illustrated in (K). (L) M1 and M2 bone marrow-derived and naïve alveolar macrophages were infected at MOI 2.5 with H37Ra and subjected to CFU assays. (M–P) Human alveolar macrophages and PBMC-derived MDMs were subjected to a Seahorse assay to measure cellular metabolism before and after 24hrs of infection with H37Ra at a MOI of 2.5. Oxygen consumption rate (OCR) shift of hAM (M) and MDM (O) prior and after infection. Extracellular acidification rate shift of hAM (N) and MDM (P) prior and after infection. Data are given as mean ± SEM. The results are representative of 2 independent experiments (A–L) and 3 (M, N) or 2 (O, P) independent healthy donors. * p<0.05; ** p<0.01; *** p<0.001; **** p<0.0001 (1-way ANOVA followed by Tukey comparison) (D, E, M–P) 2-way ANOVA followed by Bonferroni comparison or Sidak’s test.

