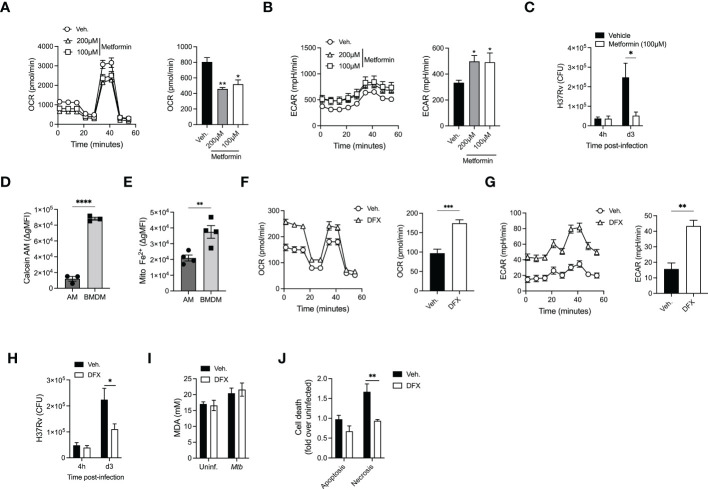
Figure 4.
AM metabolic reprogramming enhance their killing capacities. (A, B) Alveolar macrophages were treated with Metformin (100µM or 200µM) before cellular metabolism, OCR (A) and ECAR (B) was evaluated using SeaHorse. (C) Metformin-treated AM (100µM) were infected with H37Rv (MOI=1) and bacterial loads were evaluated at different days post-infection. (D, E) Geometric mean fluorescence intensity (gMFI) of Calcein-AM loaded (D) or mitochondrial iron specific dye RPA stained (E) AM (SiglecF+CD11c+ from BAL) or BMDM (CD11b+F480+). (F, G) AM were pretreated with desferrioxamine (DFX, 100µM, 24h) and cellular metabolism- OCR (F) and ECAR (G) were evaluated. (H) DFX-pretreated AM (100µM, 24h) were infected with H37Rv (MOI=1) and bacterial loads were enumerated at different days post-infection. (I) Levels of Malondialdehyde (MDA) to measure lipid peroxidation in AM pretreated with DFX (100µM, 24h) after infection by H37Rv (MOI=10, 24h p.i). (J) Levels of apoptosis and necrosis in AM treated with DFX after infection by H37Rv (MOI=10, 24h p.i). Data are representative of 3-4 independent experiments. *p<0.05; **p<0.01; ***p<0.001; ****p<0.0001 determined by 1-way ANONVA followed by Dunnett’s multiple comparison, unpaired t-test or 2-way ANOVA followed by Tukey’s or Sidak’s multiple comparison test.

