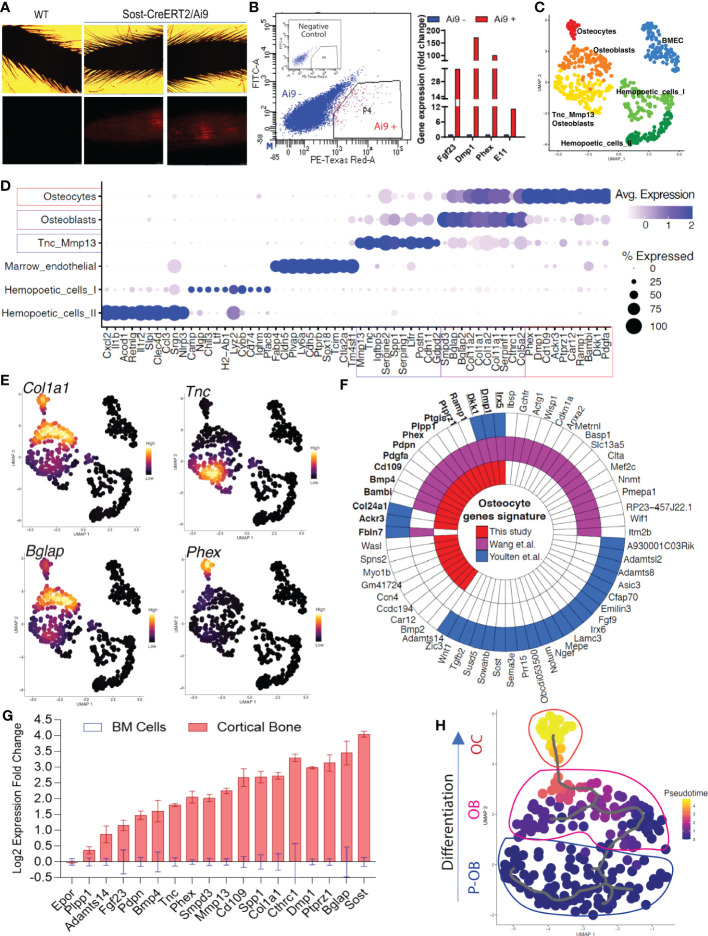
Figure 1.
Single-cell transcriptomic profiling of bone cells identified osteolineage heterogeneity. (A, B). Long bones (femur, tibia, and humeri) were subjected to serial collagenase/EDTA digestions (see Methods), and cells from fractions 4-9 were collected for FACS sorting to isolate tdTomato-positive cells, followed by single-cell RNAseq library construction. Analysis by qPCR confirmed high mRNA expression of osteocyte genes Fgf23, Dmp1, Phex, and Pdpn in Ai9 positive cells versus Ai9 negative cells. (C). Bioinformatic analysis was performed to cluster the cells by UMAP. Each dot represents a single cell, and cells sharing the same color code indicate discrete populations of transcriptionally similar cells. (D). Defining cortical bone cell types. Tnc/Mmp13 osteoblast cells were distinctly marked by Tnc and Mmp13. Osteoblast cells showed high expression of Smpd3 and Bglap. Osteocytes had the highest expression of Dmp1 and Phex. (E). Expression density plots indicated cells with high transcription of Col1a1, Tnc, Bglap, and Phex. (F). The polar figure highlights the osteocyte markers isolated from our dataset (long bone cell scRNAseq), Wang et al. (long bone and calvaria cell scRNAseq (10);) and Youlten et al. (long bone bulk RNAseq (9);). (G). Canonical and non-canonical osteolineage genes were validated as being highly expressed in cortical bone when compared to the expression detected in bone marrow. (H). Pseudotime analysis revealed Tnc/Mmp13 Osteoblasts as an osteoblast precursor cell (P-OB), and shows their differentiation to osteoblasts (OB) and then osteocytes (OC).

