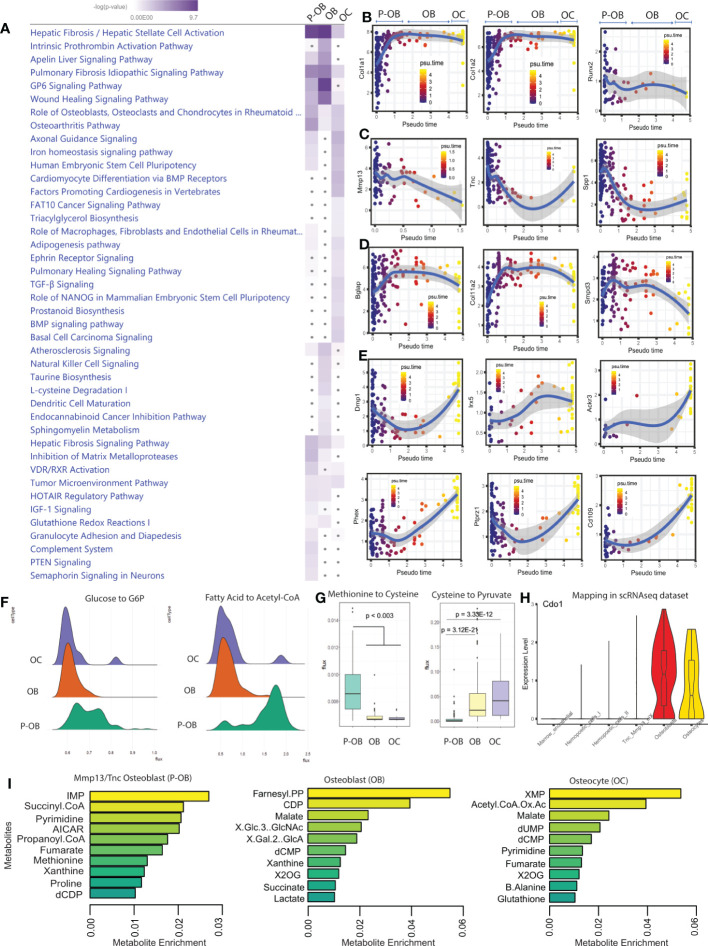
Figure 2.
Differential signaling pathways in osteoblasts versus osteocytes. (A). Ingenuity Pathway Analysis (IPA) software was used to predict the statistically significant canonical pathways upregulated in Tnc/Mmp13 osteoblasts (P-OB), osteoblasts (OB) and osteocytes (OC) from the scRNAseq data based upon a calculated probability score of ≥2 and a p-value of <0.05. Further, a comparative analysis between osteolineage cells was performed to generate the heatmap. The increase of blue intensity reflects the more significant pathways within cell types. The gray dots indicate non-significant pathways. (B–E). Monocle analysis shows pseudotime trajectory mapping of osteolineage gene sets Col1a1, Col1a2, Runx2; pre-osteoblast gene sets Mmp13, Tnc, Spp1; osteoblast gene sets Bglap, Col11a2, Smpd3; and osteocyte gene sets Dmp1, Irx5, Ackr3, Phex, Ptprz1, and Cd109. (F). The computational method scFEA was used to infer cell-wise fluxome from the scRNAseq data to predict the metabolic profiling as well as the differential metabolite conversion rate in cells that correspond to a metabolic flux value. Ridgeline plots indicate the distribution values of metabolic flux in Tnc/Mmp13 osteoblasts (P-OB), osteoblasts (OB), and osteocytes (OC). Each ridgeline represents the flux between two metabolites, shown on the x-axis, for different osteolineage cells, shown on the y-axis. (G). Violin plot displaying Cdo1 expression in scRNAseq dataset. (I). The boxplots indicate the predictive value of the conversion of methionine to cysteine and to pyruvate in P-OB, OB, and OC. (H). The bar plots show the top 10 different metabolites enriched in P-OB, OB, and OC.

