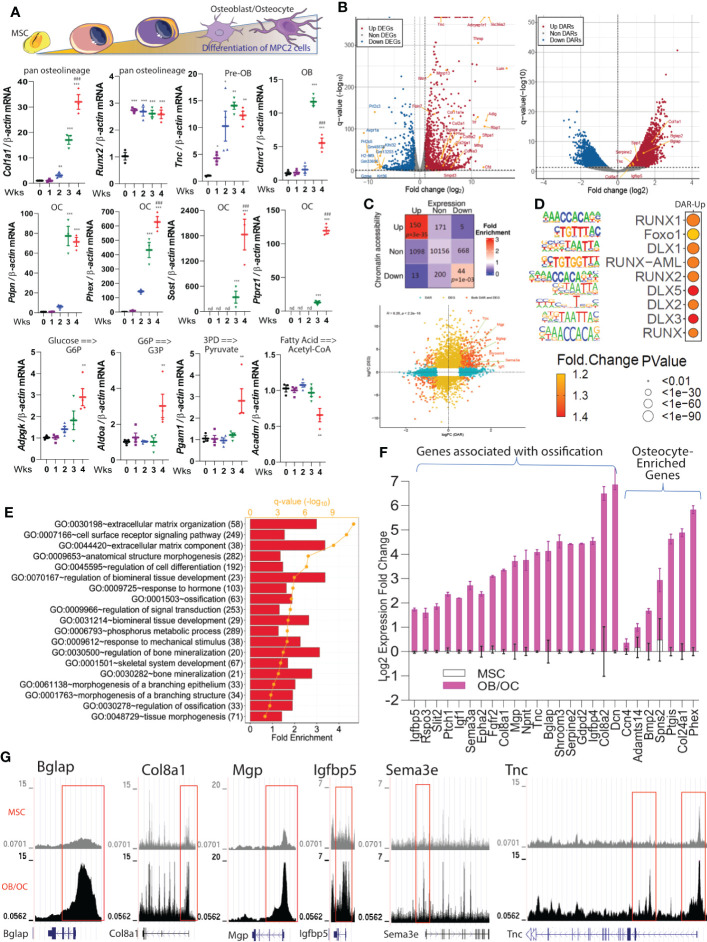
Figure 3.
Molecular markers associated with osteoblast/osteocyte differentiation. (A)-top. Schematic representing cell differentiation from MSCs to osteoblasts/osteocytes. (A)-lower. Col1a1, Runx2, Tnc, Cthrc1, Pdpn, Phex, Sost, Ptprz1, Adpgk, Pgam1, Aldoa, and Acadm mRNAs were analyzed in MPC2 cells during osteogenic differentiation over the course of 1-4 weeks and normalized to β-actin. Data are represented as mean +/- standard deviation. *p<0.05, **p<0.01, and ***p<0.001 compared to Control (0 Wks). ###p<0.001 compared to 3 Wks. nd, not detected. (B) Volcano plots derived from the bulk RNAseq (left) and ATACseq datasets (right) show the significant alterations of gene expression and chromatin accessibility detected in differentiated 3 x 3 matrix heatmap highlights the number of genes with differentially accessible regions (DARs), or differentially expressed genes (DEGs), or both DARs and DEGs when compared differentiated versus undifferentiated cells. (C) lower. Integration of ATACseq and RNAseq data exhibited a higher correlation between genome-wide chromatin accessibility changes (x-axis) and gene expression alterations (y-axis). (D) Selected motifs of more open regions of the genome in differentiated cells versus undifferentiated cells using the ATACseq. (E) Functional enrichment analysis using the Database for Annotation, Visualization and Integrated Discovery (DAVID) on upregulated DEGs with more open DARs identified biological pathways that were induced during osteogenic differentiation (numbers in parenthesis are gene counts). (F) Representative mRNA expression of upregulated genes in differentiated versus undifferentiated cells enriched in cell morphogenesis and ossification. All the genes shown were significantly upregulated (false discovery rate, FDR < 0.05). The osteocyte genes identified from the scRNAseq dataset in Figure 1J were confirmed to be significantly upregulated in osteoblasts/osteocytes cells versus control undifferentiated MPC2 cells. (G) Representative ATACseq peaks of undifferentiated cells (top track in gray) compared to differentiated cells (osteoblasts/osteocytes bottom track in black) are shown.

