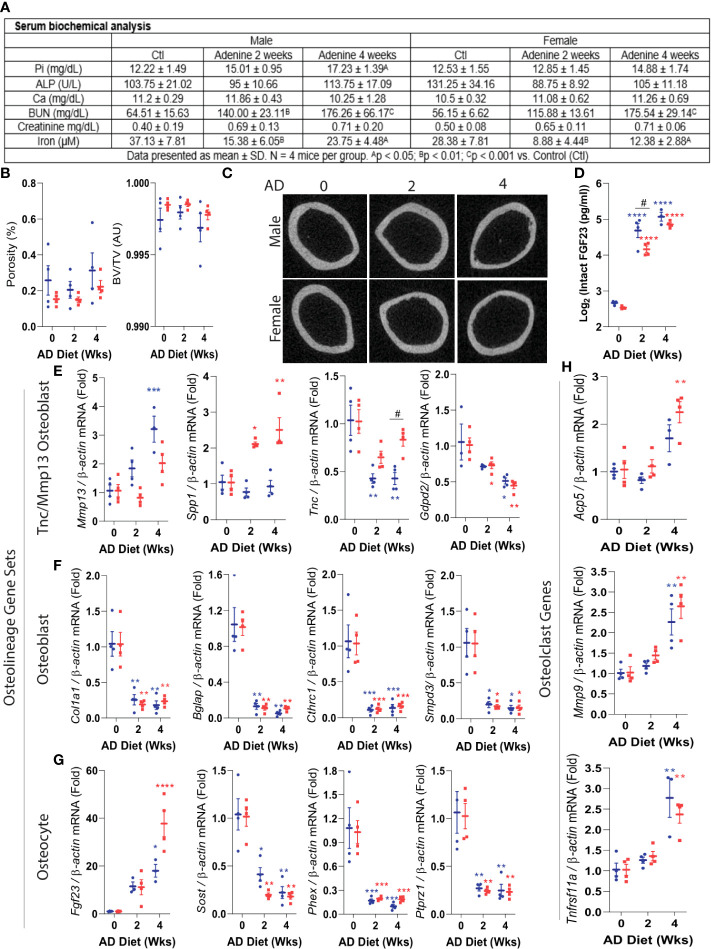
Figure 4.
Precocious misregulation of osteoblast/osteocyte genes in CKD. Eight-week old wild type C57BL/6 male (shown in blue) and female (represented in red) mice were fed an adenine diet (AD) to induce CKD for 2, or 4 weeks. Mice fed the casein diet for 2 weeks were used as controls. (A) Key serum biochemical analyses: phosphate, alkaline phosphatase, calcium, blood urea nitrogen, creatinine, and iron are shown. (B) Cortical porosity (left) and trabecular bone volume (right) were measured using micro computed tomography (μCT). (C) Representative images of cortical bone μCT. (D) Circulating FGF23 was assessed by ELISA. (E-H). Real-time qPCR was used to measure the mRNA expression of Tnc/Mmp13 osteoblast (pre-osteoblast), osteoblast and osteocyte gene sets, as well as osteoclast genes. Data are shown as fold change (2-ΔΔCt) relative to the housekeeping gene β-Actin and normalized to the experimental control (‘AD0’). The ‘AD 0’ mice were fed with a control diet (Casein) and sacrificed at 2 weeks; ‘AD 2’ mice were fed with a CKD diet (adenine) and sacrificed at 2 weeks; and the ‘AD 4’ were mice fed with the adenine diet and sacrificed at 4 weeks. Data are represented as mean +/- standard deviation. *p<0.05, **p<0.01, ***p<0.001, ****p<0.001 compared to Control.

