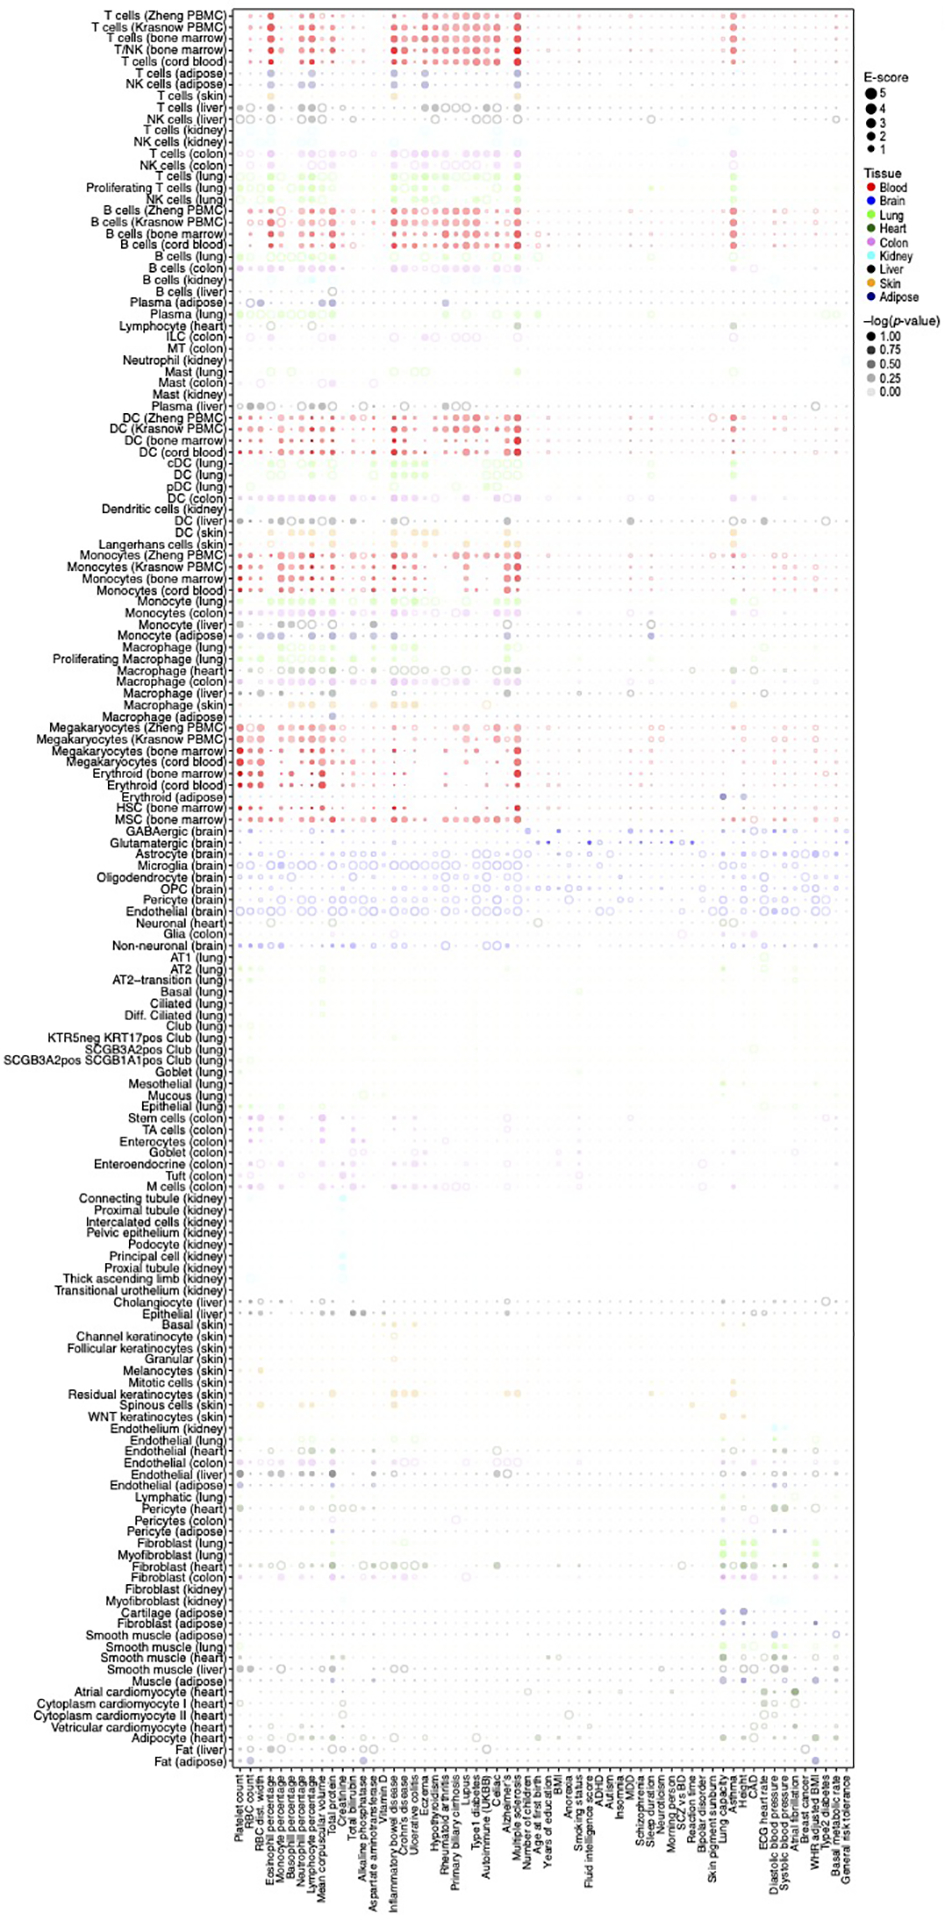
Extended Data Fig. 3. Linking cell type programs to diseases and traits across all analyzed tissues.

Magnitude (E-score, dot size) and significance (−log10(P-value), dot color) of the heritability enrichment of cell type programs (columns) from each of nine tissues (color code, legend) for GWAS summary statistics of diverse traits and diseases (rows), based on the Roadmap∪ABC enhancer-gene linking strategy for the corresponding tissue. Details for all traits analyzed are in Supplementary Table 2. See Data Availability for higher resolution version of this figure.
