
Extended Data Fig. 4. Cross trait analysis of cell type enrichments.
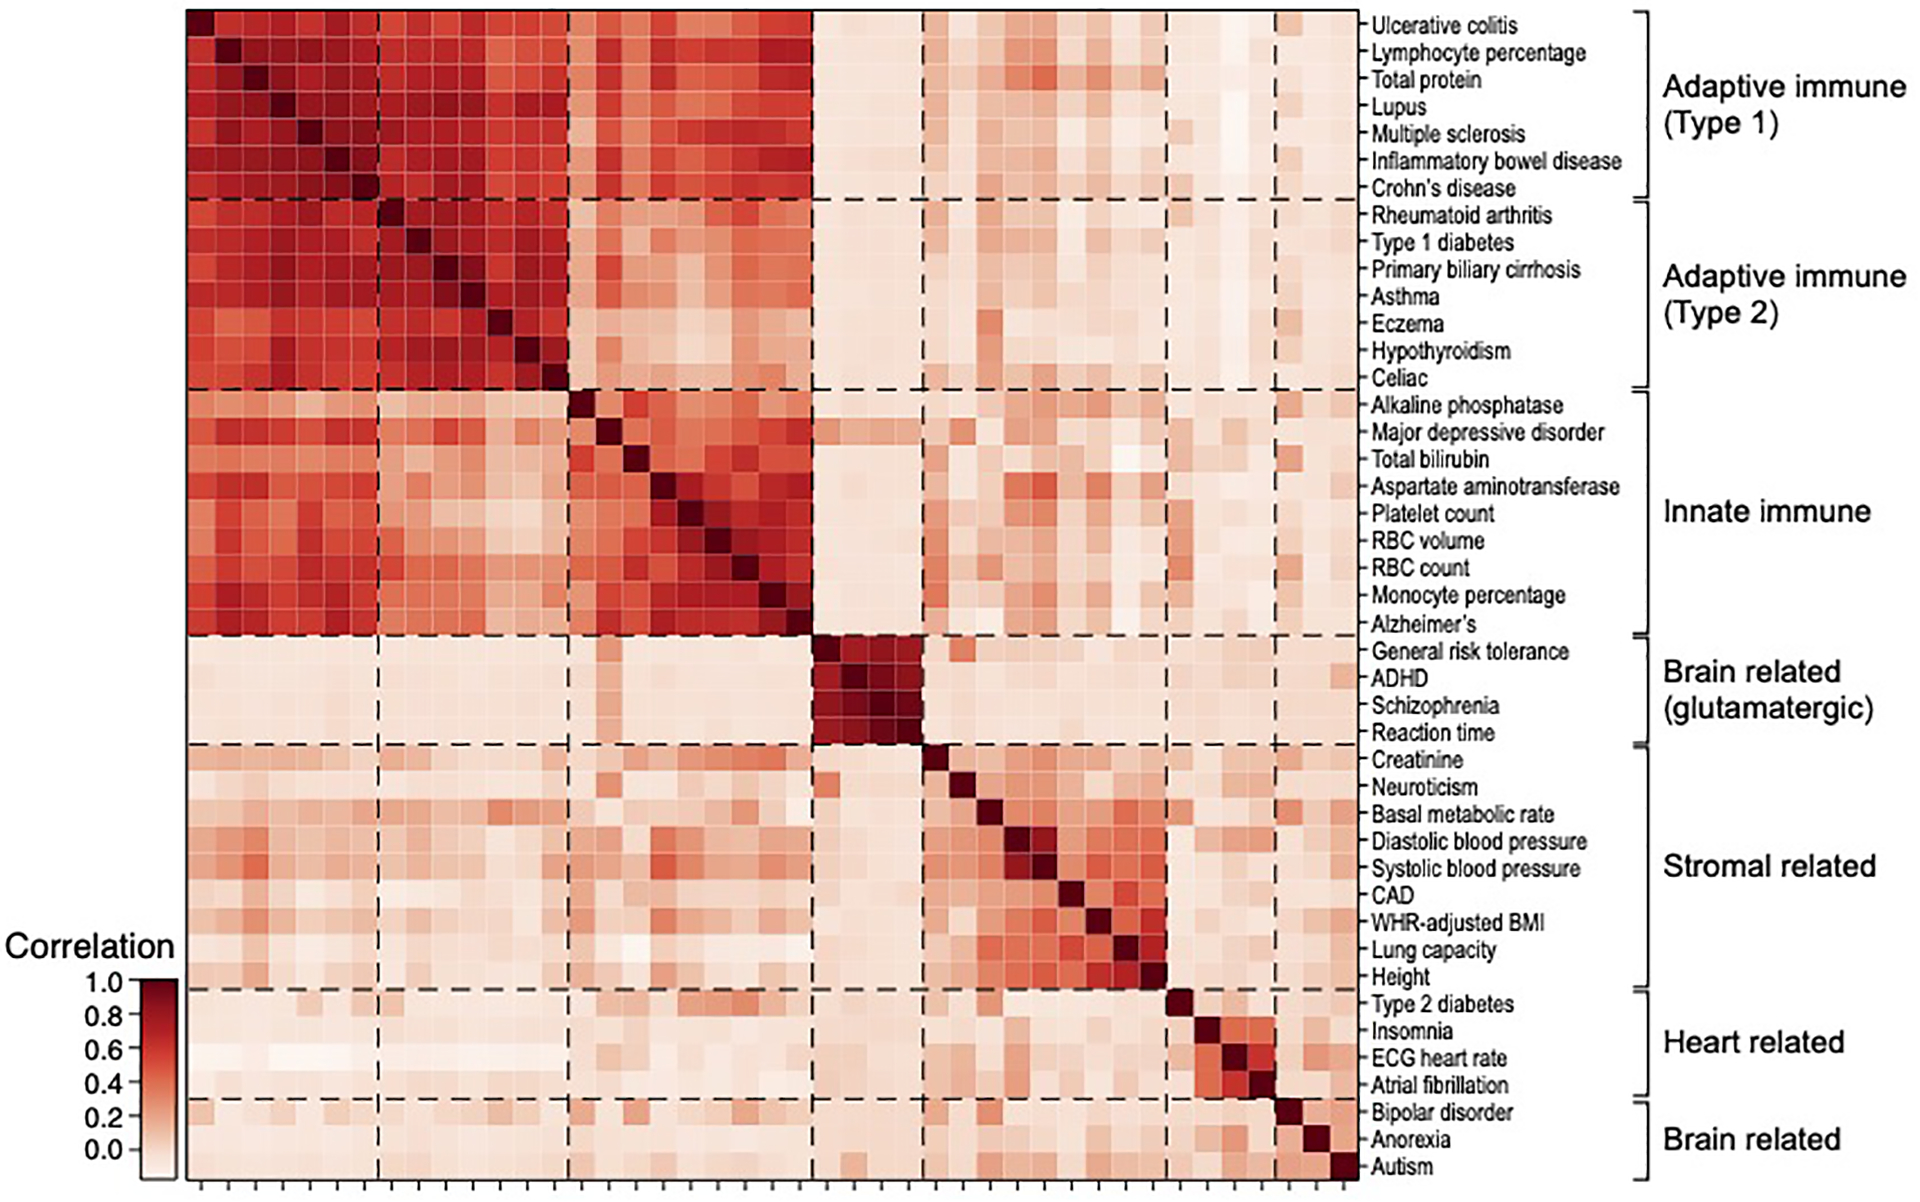
Pearson correlation coefficient (colorbar) between the cell type enrichment profiles of each pair of traits (rows, columns), clustered (dashed lines) hierarchically. Trait clusters labeled by their overall cell type enrichments.