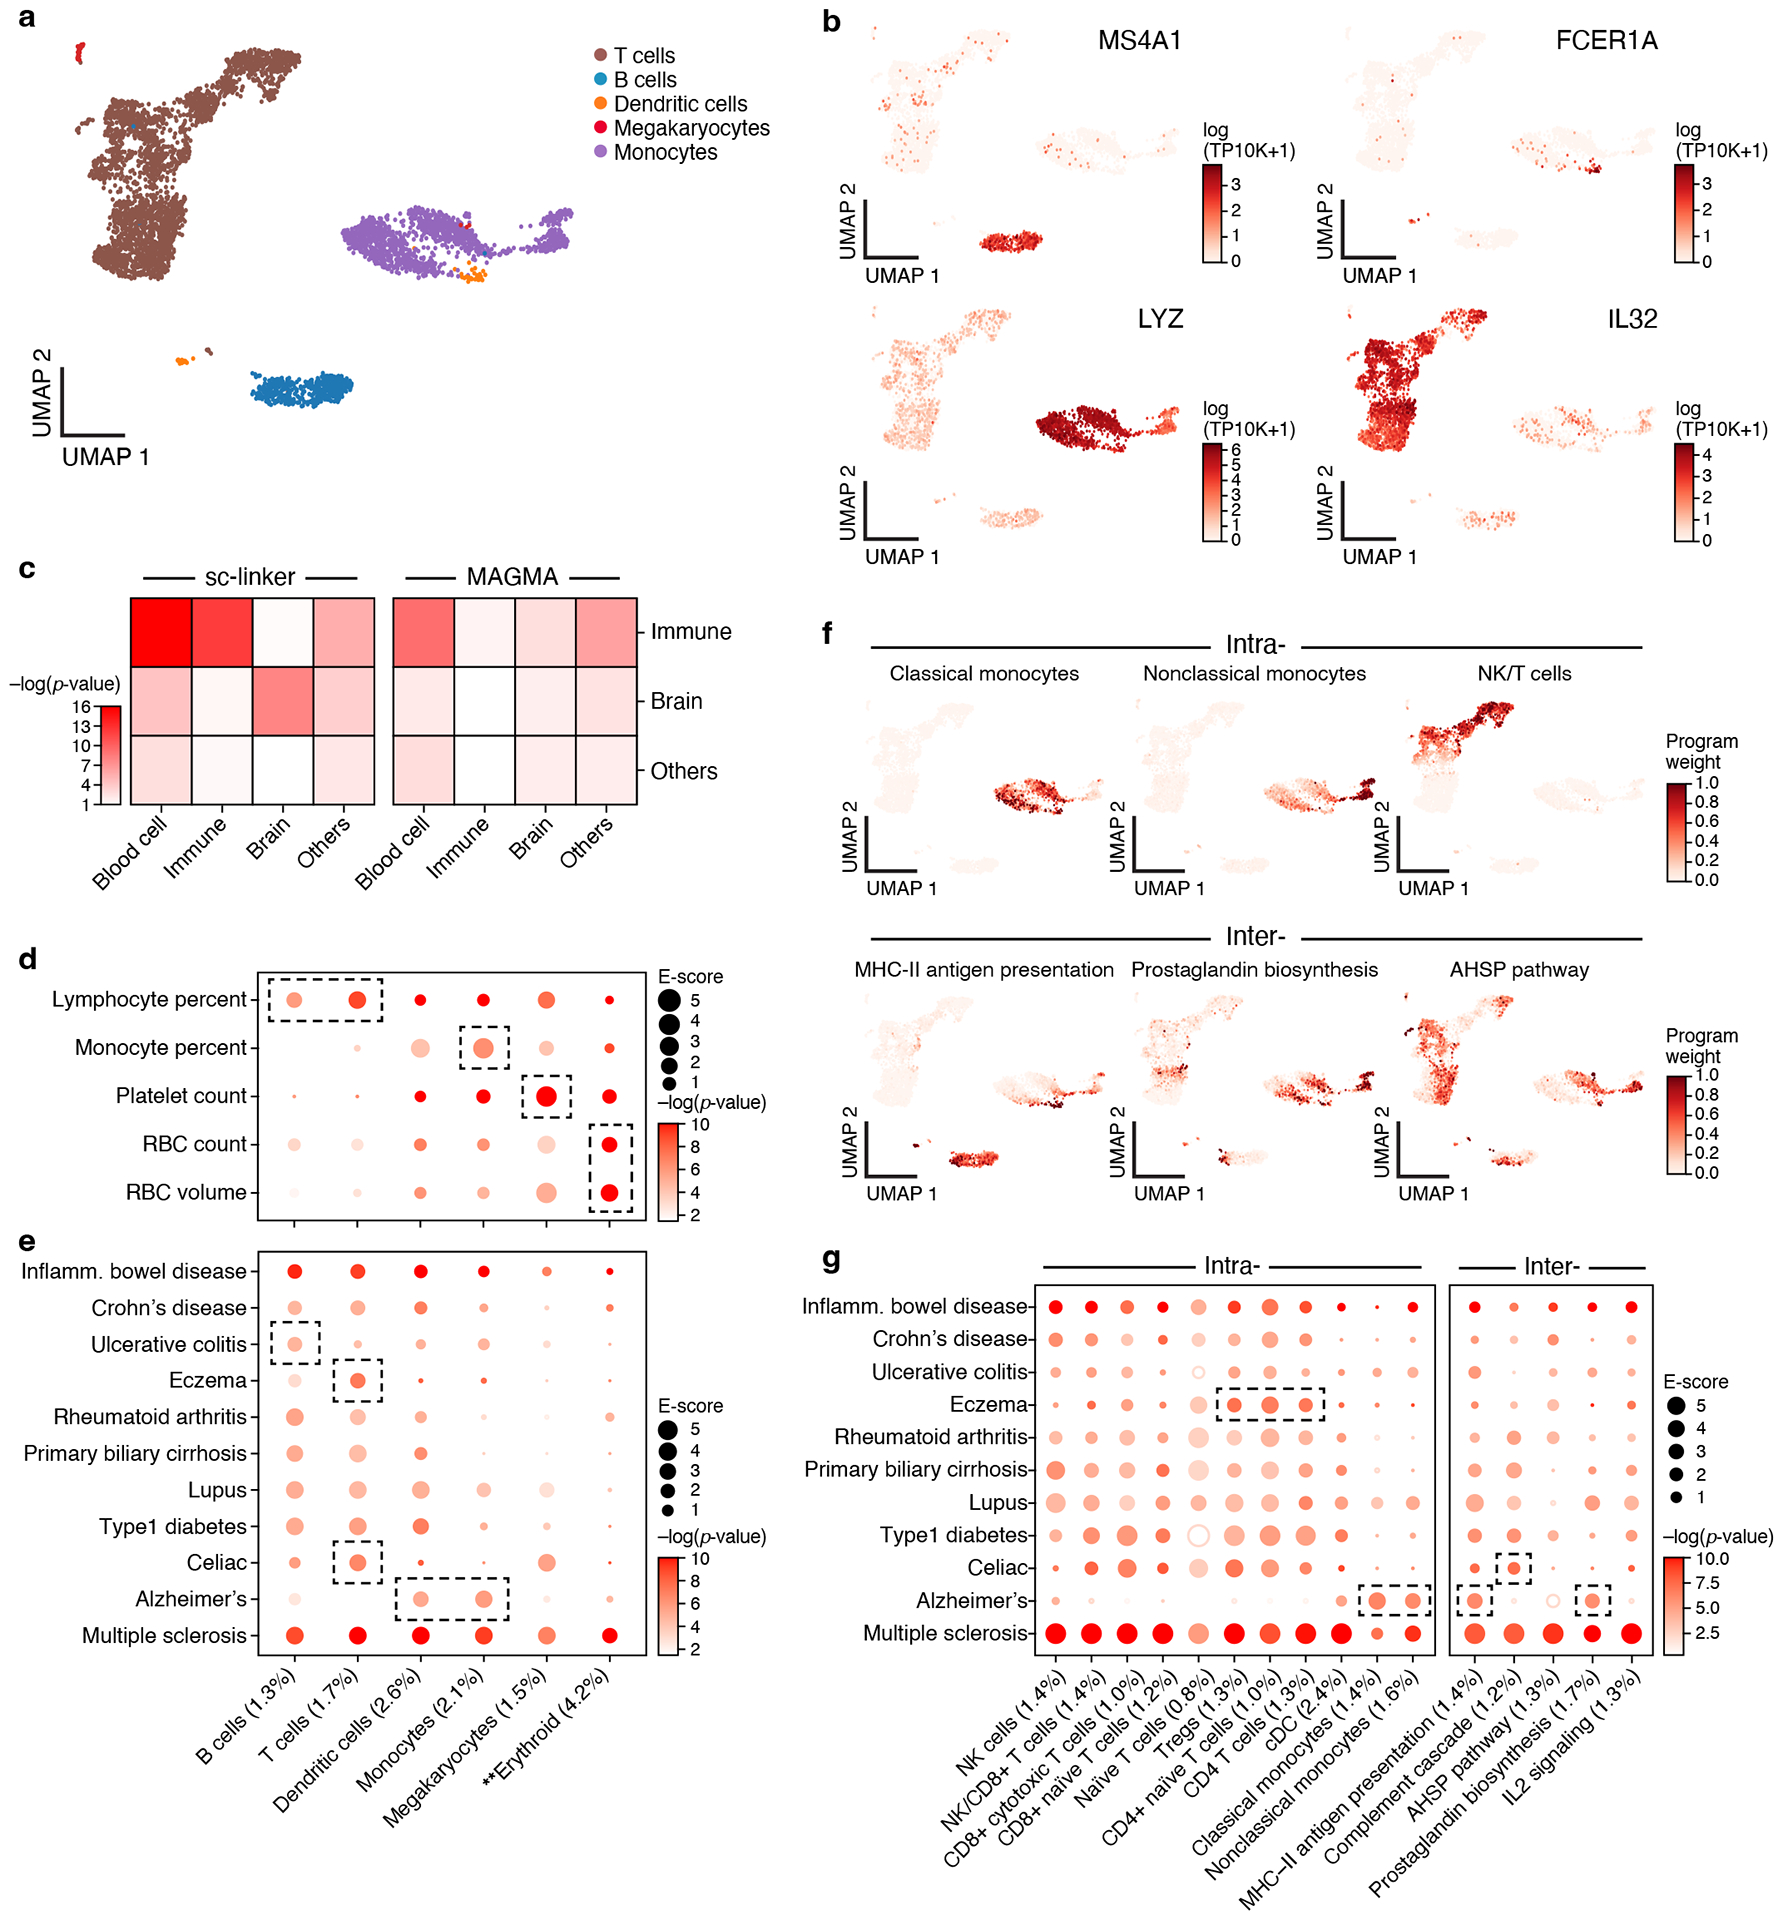
Figure 2. Linking immune cell types and cellular processes to immune-related diseases and blood cell traits.

a,b. Immune cell types. Uniform Manifold Approximation and Projection (UMAP) embedding of peripheral blood mononuclear cell (PBMC) scRNA-seq profiles (dots) colored by cell type annotations (a) or expression of cell-type-specific genes (b). c. Benchmarking of sc-linker vs. MAGMA. Significance (average −log10(p-value)) of association between immune, brain and other tissue cell type programs (rows) and blood cell, immune-related, brain-related and other traits (columns) for sc-linker (left) and MAGMA gene set analysis (right). Other cell types × other diseases/traits are not included in the specificity calculation, due to the broad set of cell types and diseases/traits in this category. For the MAGMA analysis, the gene program is binarized using a threshold=0.95; numerical results for other binarization thresholds and continuous variable based approaches are reported in Supplementary Data 7. d,e. Enrichments of immune cell type programs for blood cell traits and immune-related diseases. Magnitude (E-score, dot size) and significance (−log10(P-value), dot color) of the heritability enrichment of immune cell type programs (columns) for blood cell traits (rows, d) or immune-related diseases (rows, e). f. Examples of inter- and intra-cell type cellular process programs. UMAP of PBMC (as in a), colored by each program weight (color bar) from non-negative matrix factorization (NMF). g. Enrichments of immune cellular process programs for immune-related diseases. Magnitude (E-score, dot size) and significance (−log10(p-value), dot color) of the heritability enrichment of cellular process programs (columns) for immune-related diseases (rows). In panels d,e,g, the size of each corresponding SNP annotation (% of SNPs) is reported in parentheses, and the dashed boxes denote results that are highlighted in the main text. Numerical results are reported in Supplementary Data 1,3. Further details of all diseases and traits analyzed are provided in Supplementary Table 2. **Erythroid cells were observed in only bone marrow and cord blood datasets.
