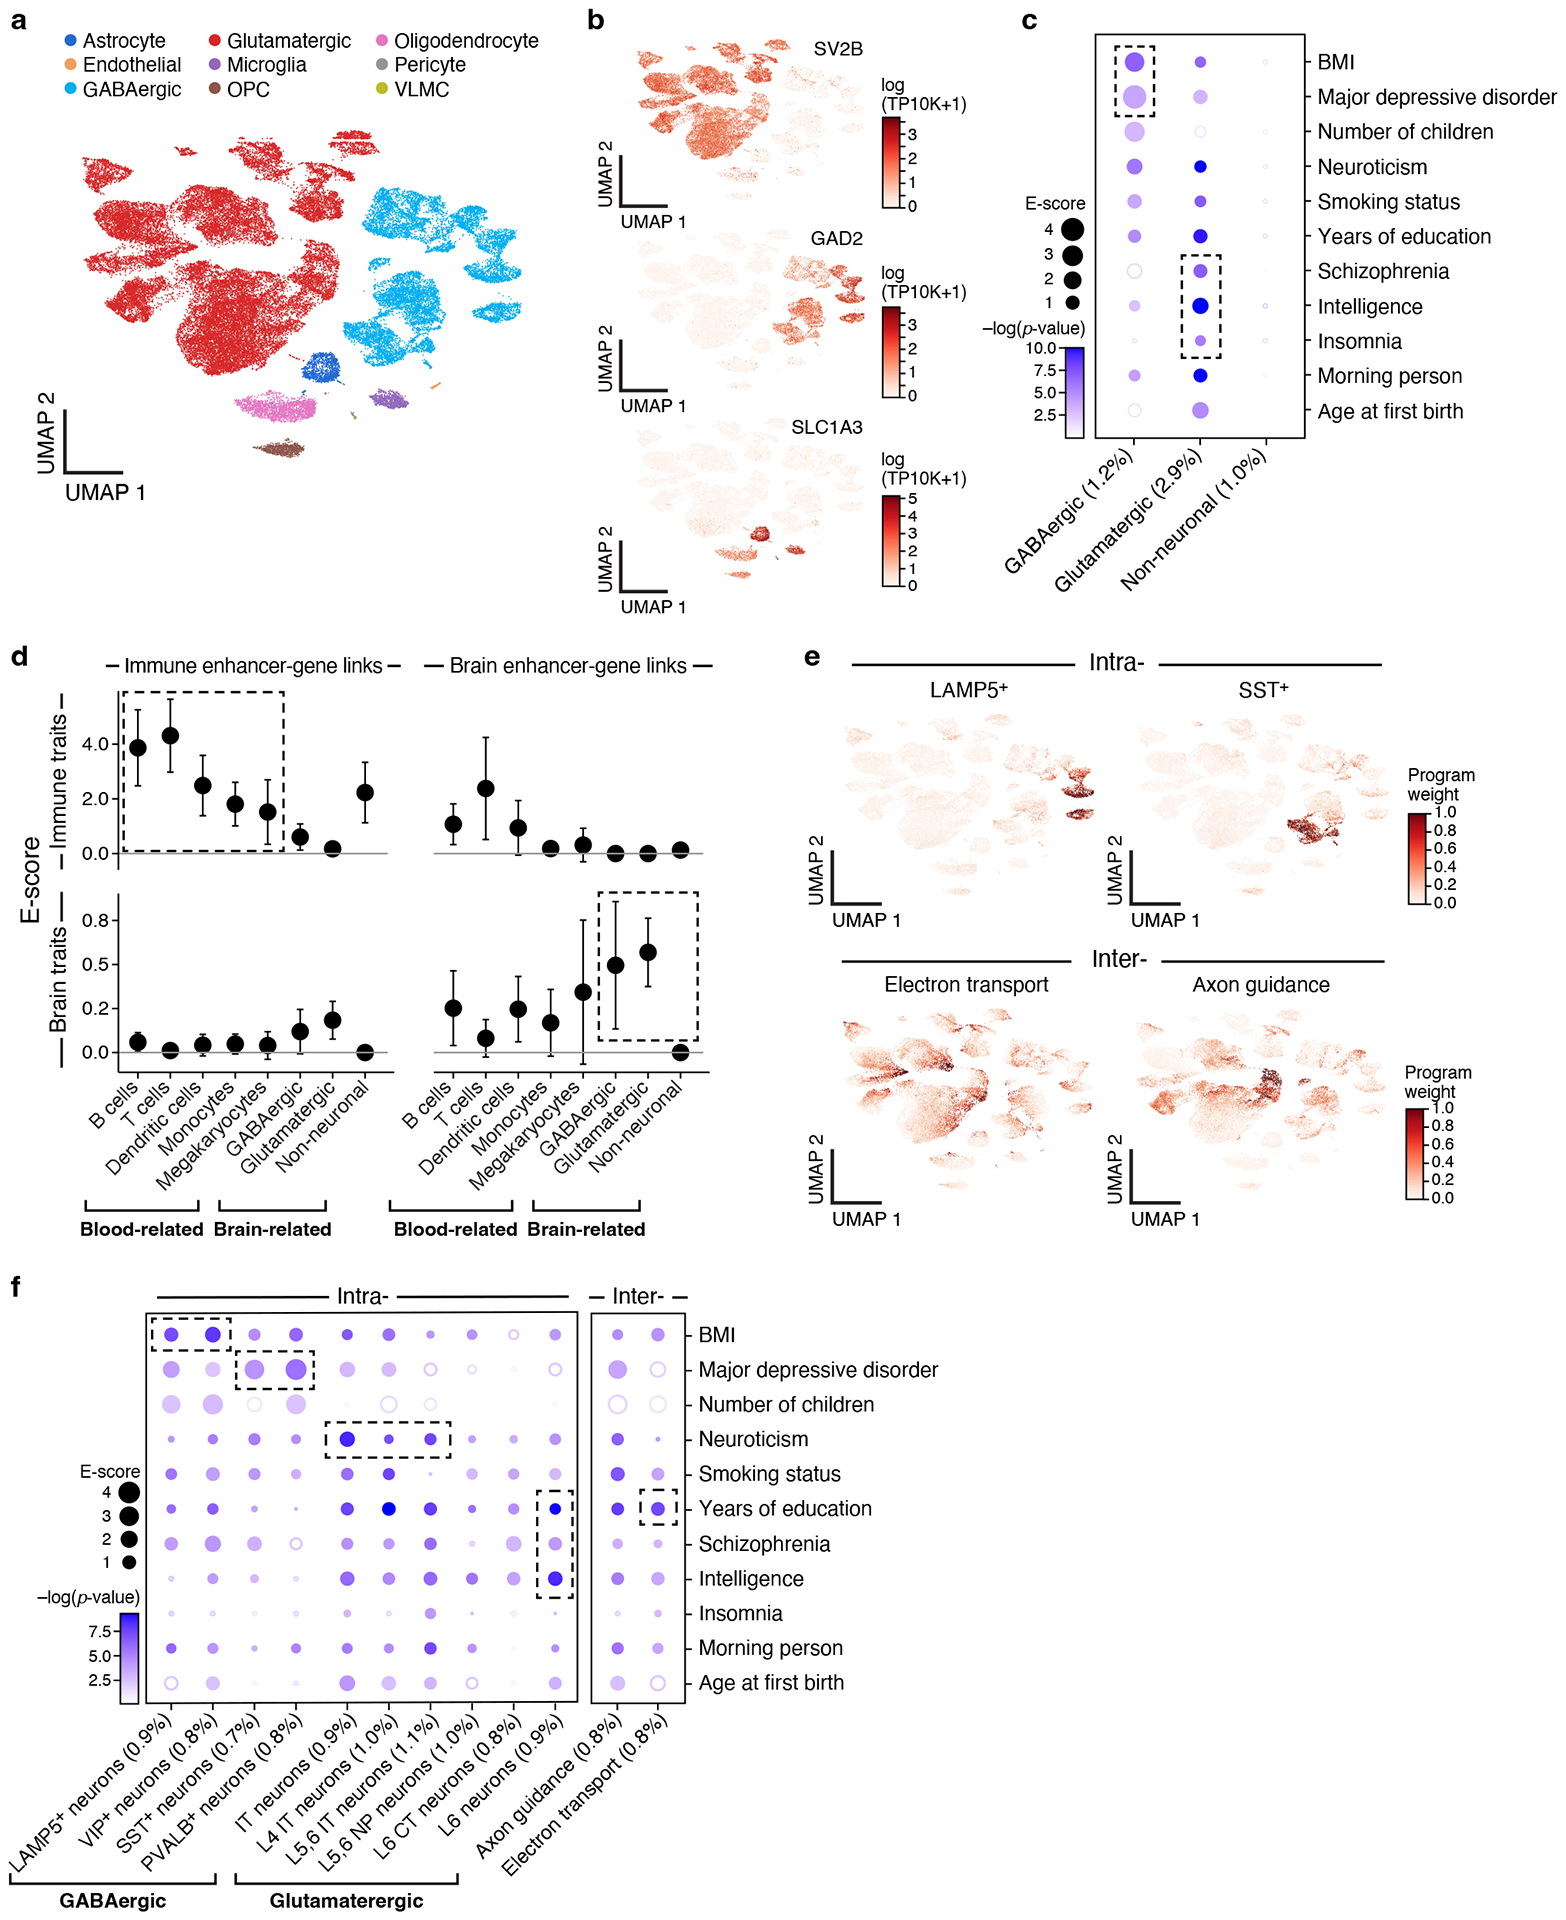
Figure 3. Linking neuron cell subsets and cellular processes to brain-related diseases and traits.

a,b. Major brain cell types. UMAP embedding of brain scRNA-seq profiles (dots) colored by cell type annotations (a) or expression of cell-type-specific genes (b). c. Enrichments of brain cell type programs for brain-related diseases and traits. Magnitude (E-score, dot size) and significance (−log10(P-value), dot color) of the heritability enrichment of brain cell type programs (columns) for brain-related diseases and traits (rows). d. Comparison of immune vs. brain cell type programs, enhancer-gene linking strategies, and diseases/traits. Magnitude (E-score and SE) of the heritability enrichment of immune vs. brain cell type programs (columns) constructed using immune vs. brain enhancer-gene linking strategies (left and right panels) for immune-related (n=11) vs. brain-related (n=11) diseases and traits (top and bottom panels). Data are presented as mean values +/− SEM. e. Examples of inter- and intra-cell type cellular processes. UMAP (as in a), colored by each program weight (color bar) from non-negative matrix factorization (NMF). f. Enrichments of brain cellular process programs for brain-related diseases and traits. Each of the cellular process programs is constructed using NMF to decompose the cells by genes matrix into two matrices, cells by programs and programs by genes. Magnitude (E-score, dot size) and significance (−log10(P-value), dot color) of the heritability enrichment of cellular process programs (columns) for brain-related diseases and traits (rows). In panels c and f, the size of each corresponding SNP annotation (% of SNPs) is reported in parentheses. Numerical results are reported in Supplementary Data 1,3. Further details of all diseases and traits analyzed are provided in Supplementary Table 2.
