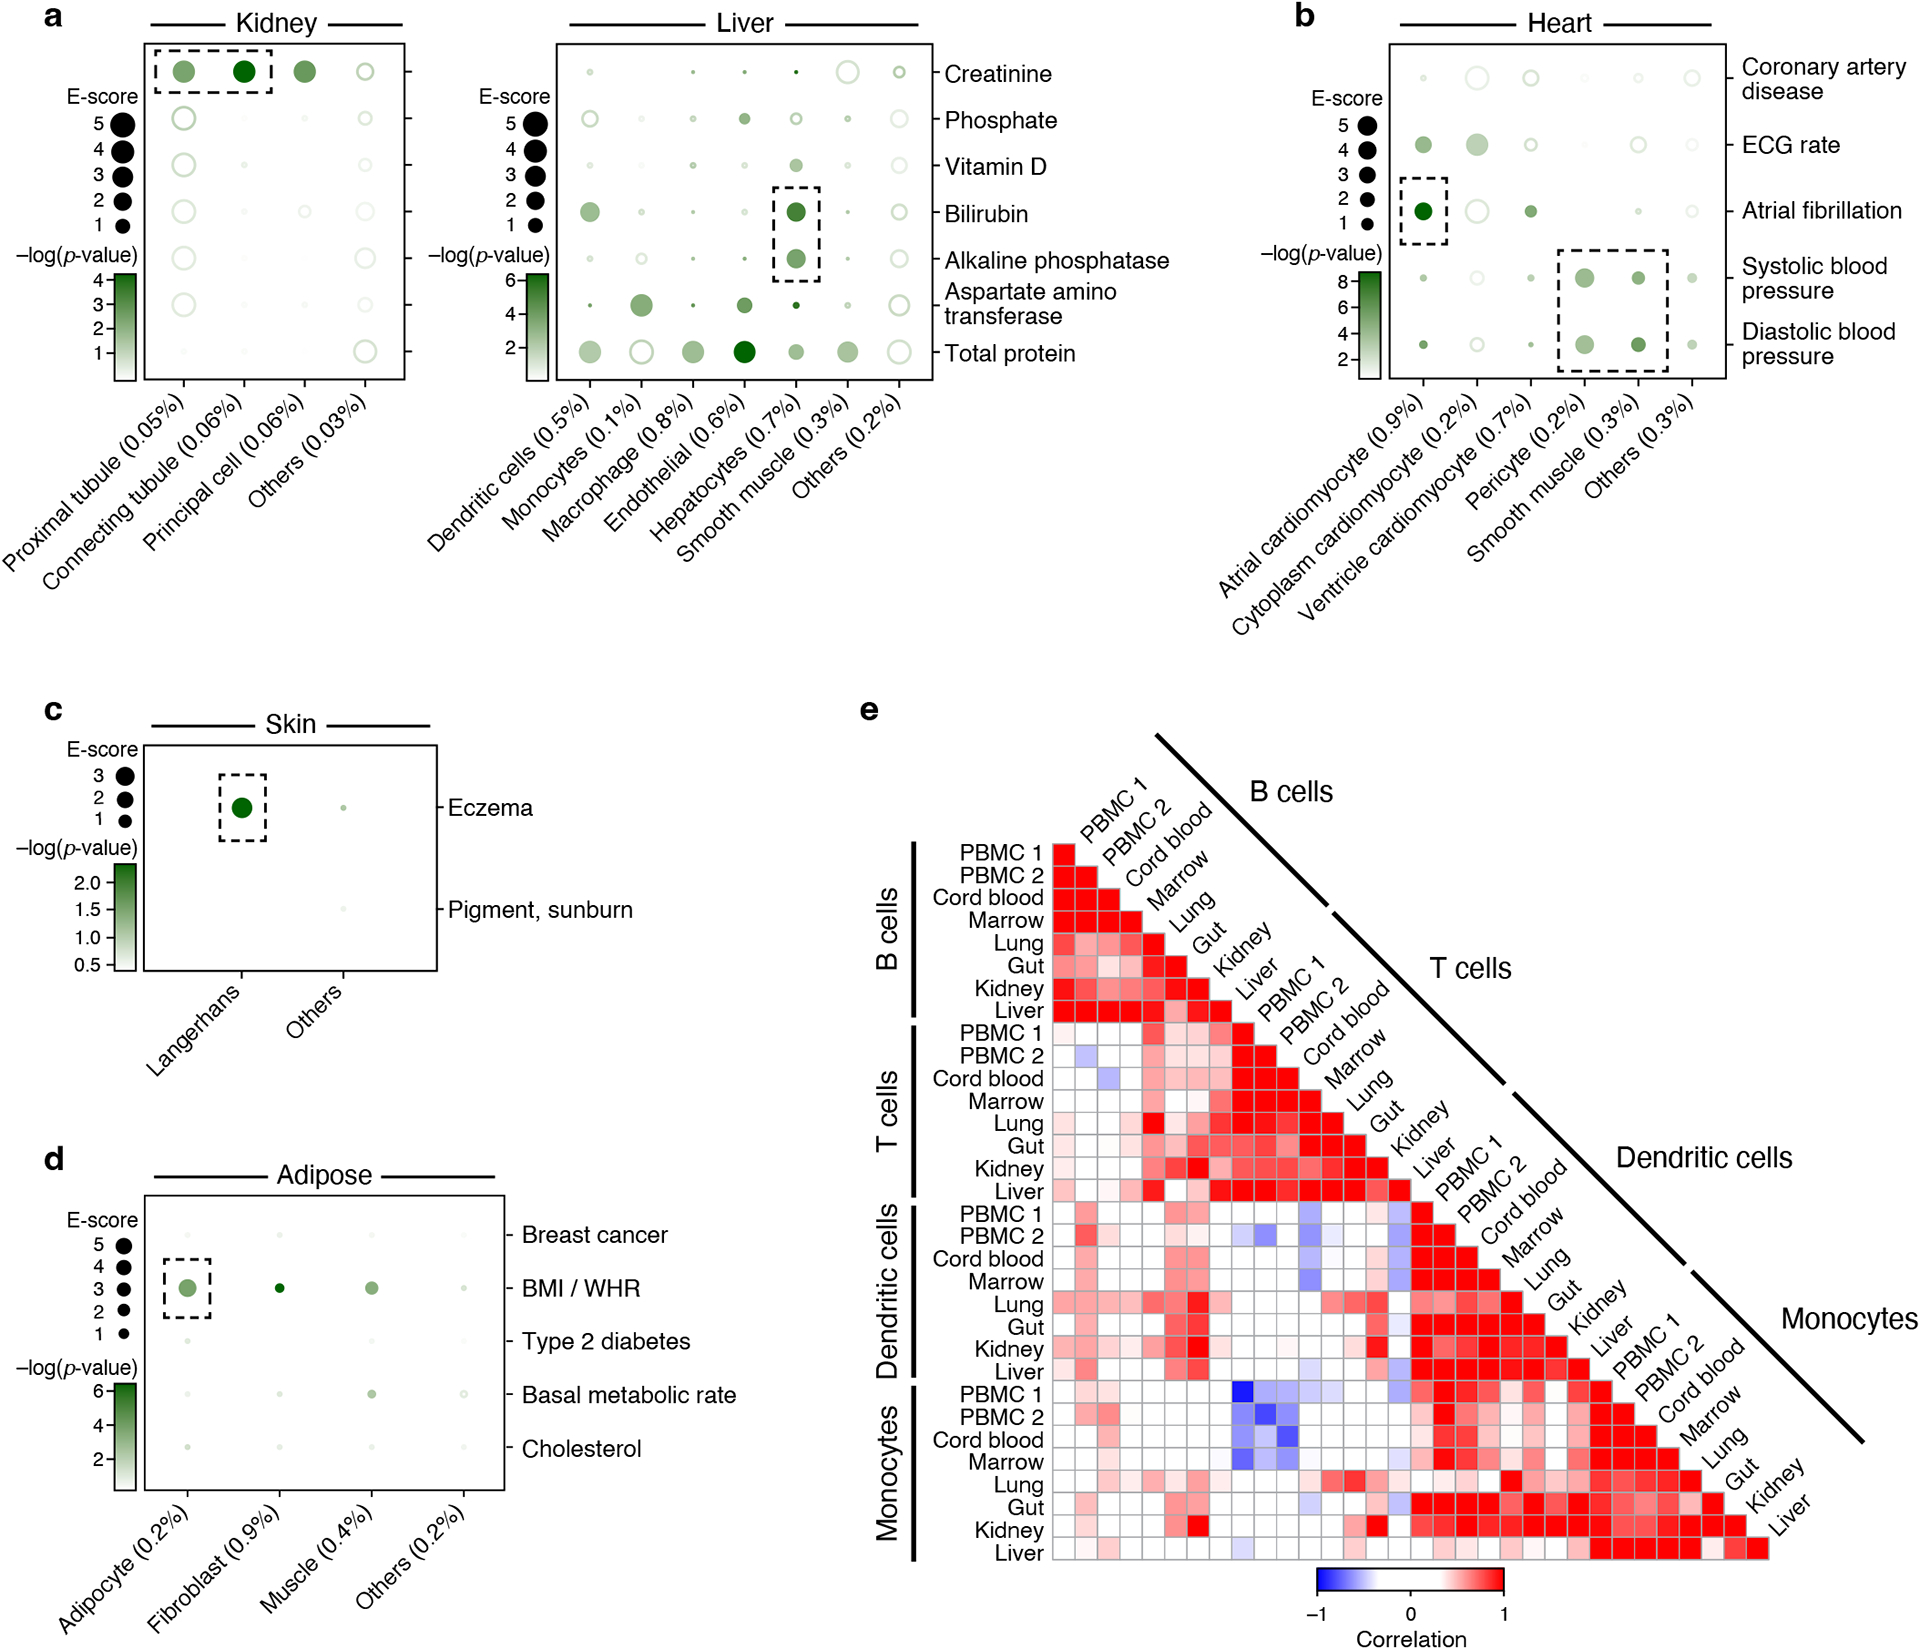
Figure 4. Linking cell types from diverse human tissues to disease.

a-d. Enrichments of cell type programs for corresponding diseases and traits. Magnitude (E-score, dot size) and significance (−log10(P-value), dot color) of the heritability enrichment of cell type programs (columns) for diseases and traits relevant to the corresponding tissue (rows) for kidney and liver (a), heart (b), skin (c) and adipose (d). The size of each corresponding SNP annotation (% of SNPs) is reported in parentheses. Numerical results are reported in Supplementary Data 1. Further details of all traits analyzed are provided in Supplementary Table 2. e. Correlation of immune cell type programs across tissues. Pearson correlation coefficients (color bar) of gene-level program memberships for immune cell type programs across different tissues (rows, columns), grouped by cell type (labels).
