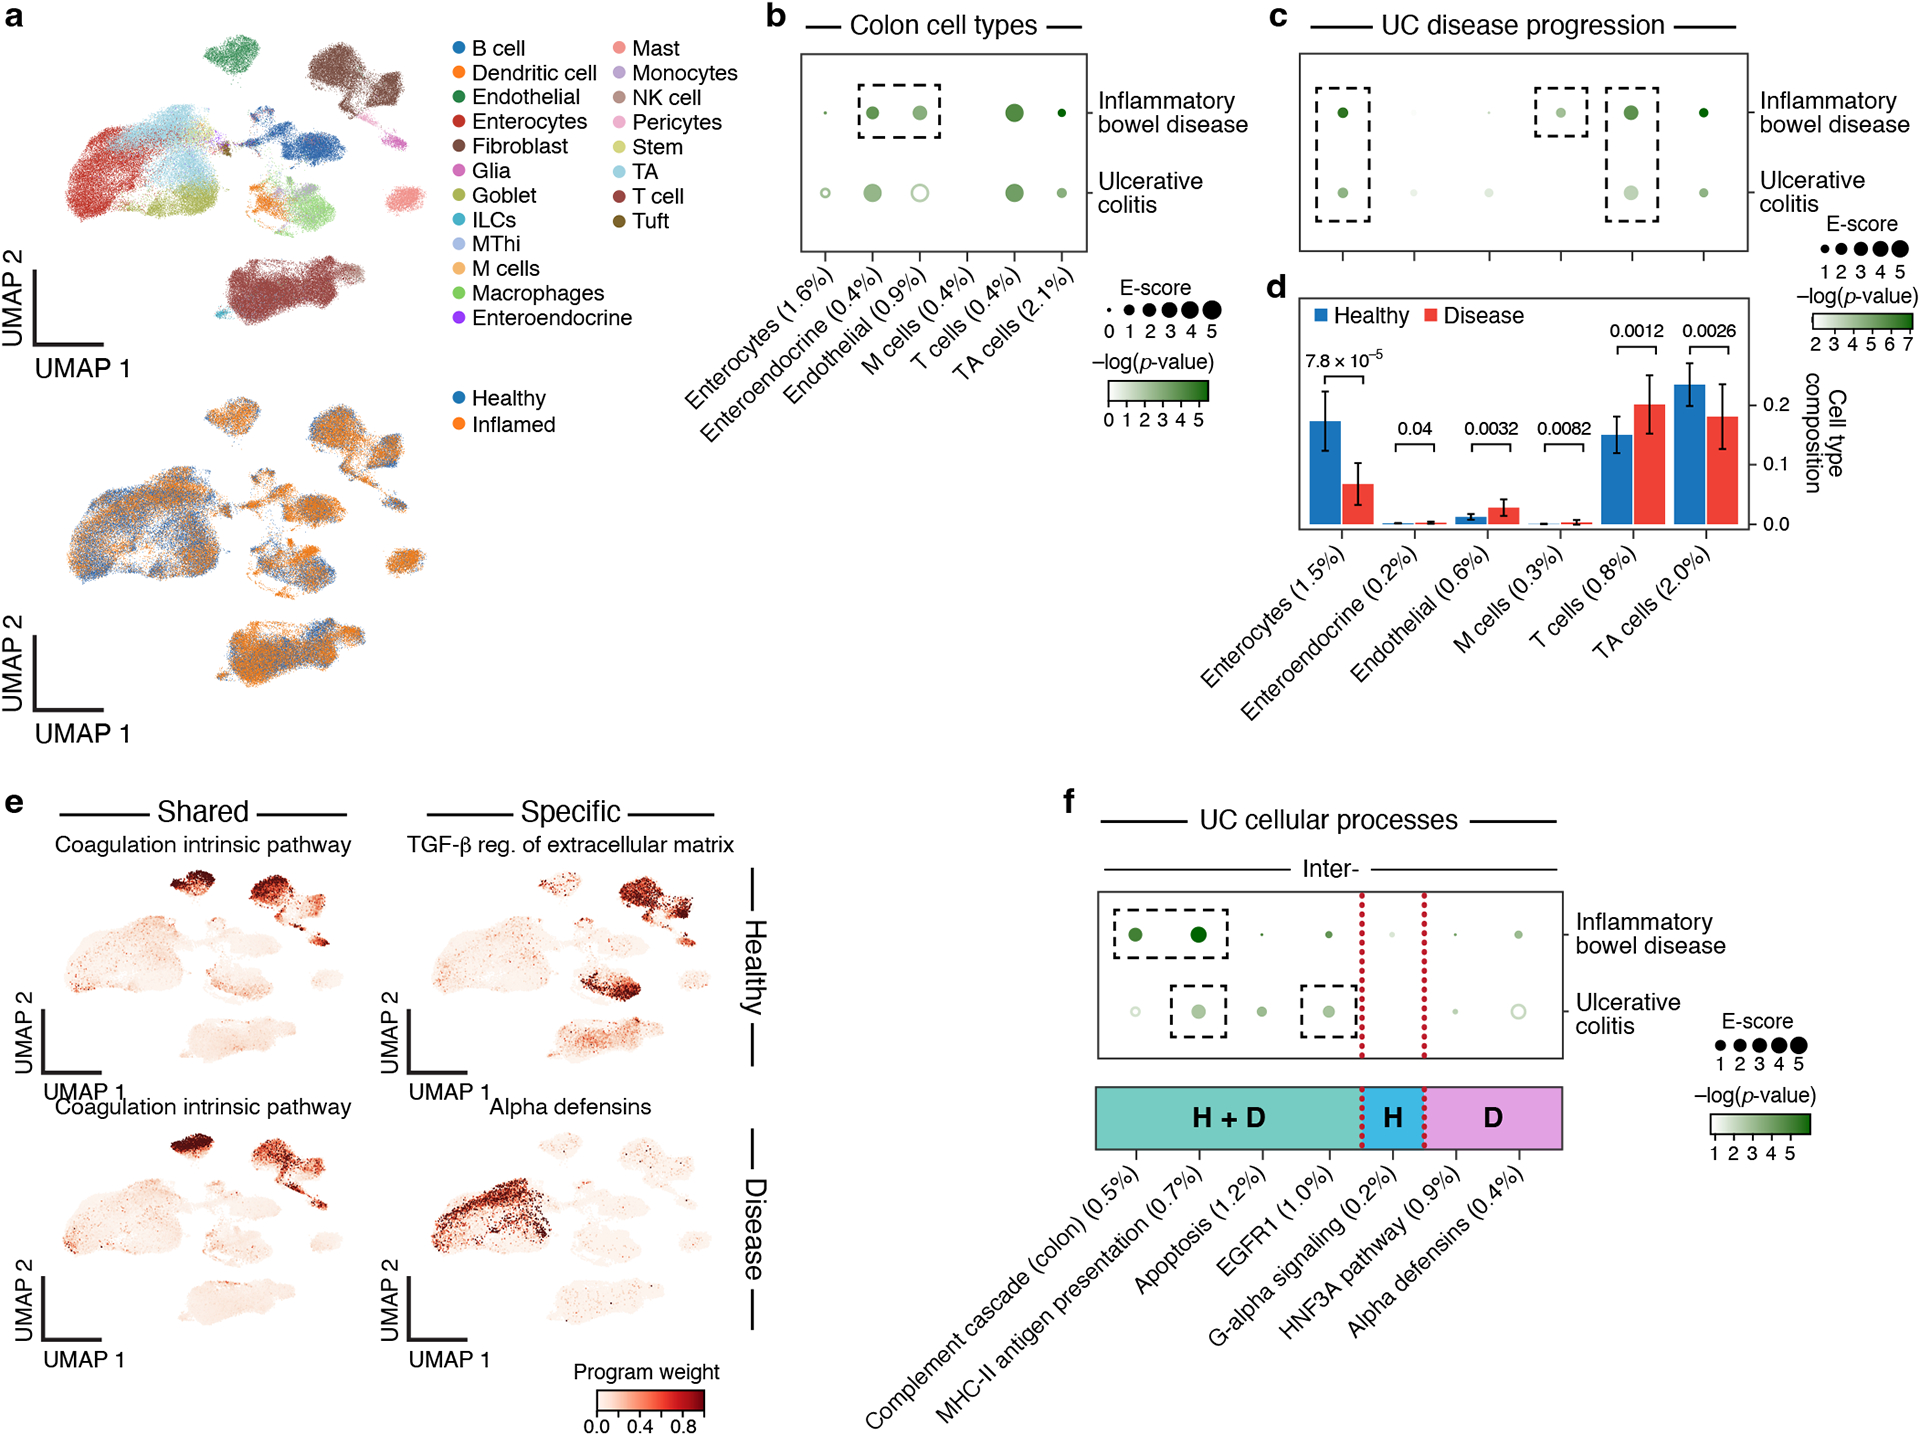
Figure 6. Linking UC disease-dependent and cellular process programs to UC and IBD.

a. UMAP embedding of scRNA-seq profiles (dots) from UC and healthy colon tissue, colored by cell type annotations (top) or disease status (bottom). b. Enrichments of healthy colon cell types for disease. Magnitude (E-score, dot size) and significance (−log10(P-value), dot color) of the heritability enrichment of colon cell type programs (columns) for IBD or UC (rows). Results for additional cell types, including immune cell types in colon, are reported in Extended Data Fig. 3 and Supplementary Data 1. c. Enrichments of UC disease-dependent programs for disease. Magnitude (E-score, dot size) and significance (−log10(P-value), dot color) of the heritability enrichment of UC disease-dependent programs (columns) for IBD or UC (rows). d. Proportion (mean and SE) of the corresponding cell types (columns) in healthy (blue) and UC (red) n=36 biologically independent colon samples. P-value: one sided Fisher’s exact test. e. Examples of shared (healthy and disease), healthy-specific, and disease-specific cellular process programs. UMAP (as in a), colored by each program weight (color bar) from NMF. f. Enrichments of UC cellular process programs for disease. Magnitude (E-score, dot size) and significance (−log10(P-value), dot color) of the heritability enrichment of inter-cell type cellular processes (shared (H+D), healthy-specific (H), or disease-specific (D)) (columns) for IBD or UC (rows). In panels b,c,d,f, the size of each corresponding SNP annotation (% of SNPs) is reported in parentheses. Numerical results are reported in Supplementary Data 1,2,3. Further details of all traits analyzed are provided in Supplementary Table 2.
