
Figure 7. Linking asthma disease-dependent and cellular process programs to asthma and lung capacity.
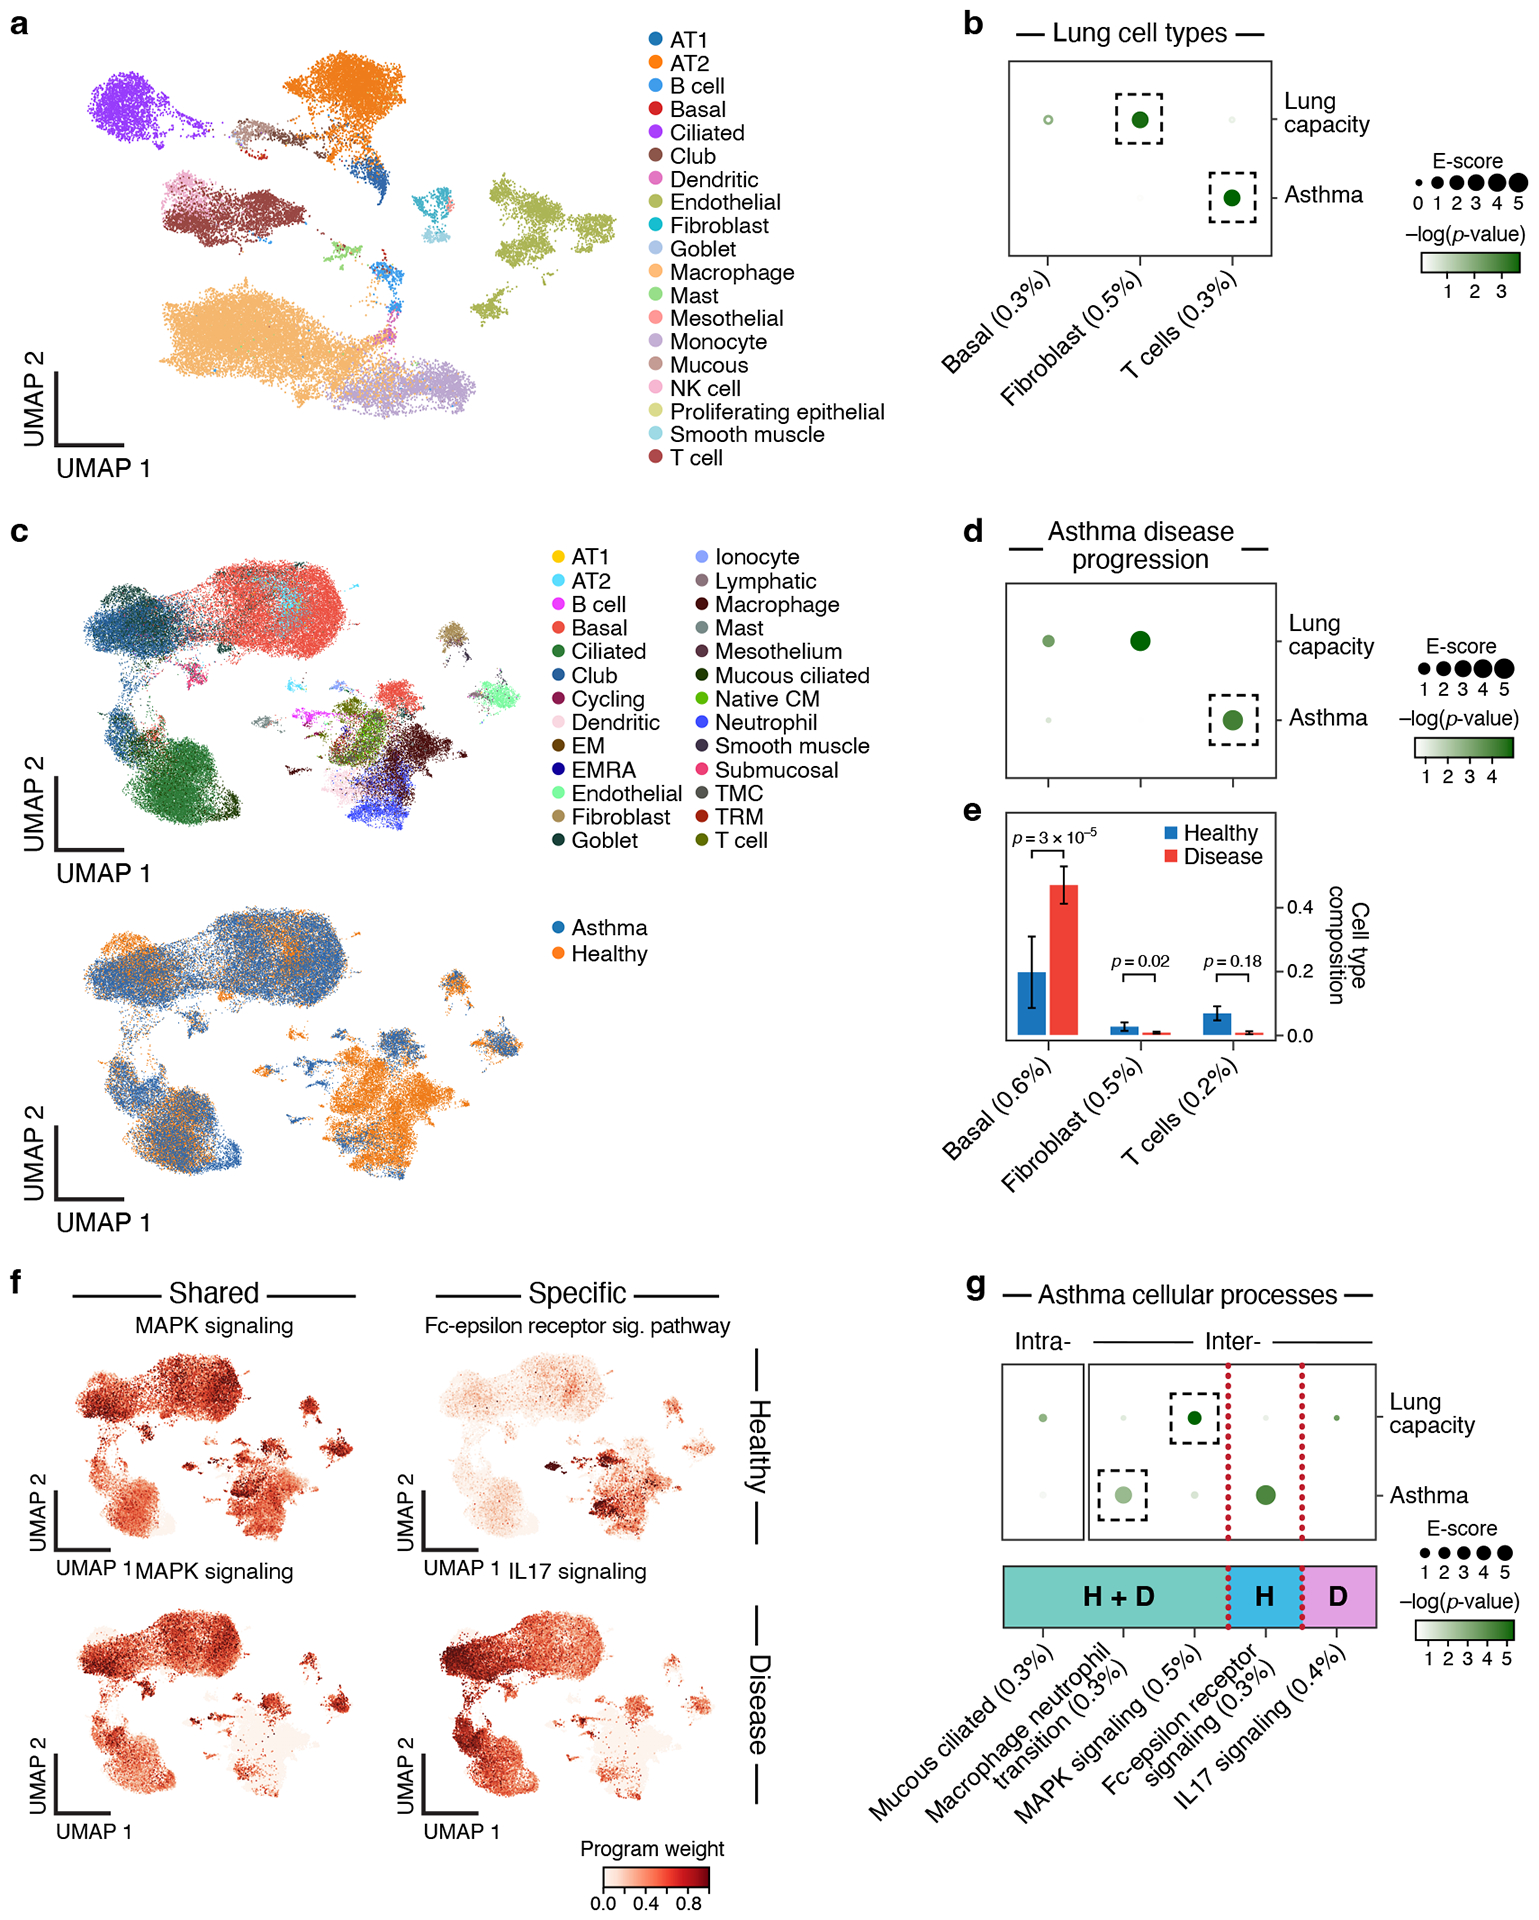
a. UMAP embedding of healthy lung scRNA-seq profiles (dots) colored by cell type annotations. b. Enrichments of healthy lung cell types for disease. Magnitude (E-score, dot size) and significance (−log10(P-value), dot color) of the heritability enrichment of healthy lung cell type programs (columns) for lung capacity or asthma (rows). c. UMAP embedding of scRNA-seq profiles (dots) from asthma and healthy lung tissue, colored by cell type annotations (top) or disease status (bottom). d. Enrichments of asthma disease-dependent programs for disease. Magnitude (E-score, dot size) and significance (−log10(P-value), dot color) of the heritability enrichment of asthma disease-dependent programs (columns) for lung capacity or asthma (rows). e. Proportion (mean and SE) of the corresponding cell types (columns), in healthy (blue) and asthma (red) n=54 biologically independent lung samples. P-value: one-sided Fisher’s exact test. f. Examples of shared (healthy and disease), healthy-specific, and disease-specific cellular process programs. UMAP (as in c), colored by each program weight (color bar) from NMF. g. Enrichments of asthma cellular process programs for disease. Magnitude (E-score, dot size) and significance (−log10(P-value), dot color) of the heritability enrichment of intra-cell type (left) and inter-cell type (right) cellular processes (shared (H+D), healthy-specific (H), or disease-specific (D)) (columns) for lung capacity and asthma GWAS summary statistics (rows). In panels b,d,e,g, the size of each corresponding SNP annotation (% of SNPs) is reported in parentheses. Numerical results are reported in Supplementary Data 1,2,3. Further details of all traits analyzed are provided in Supplementary Table 2.