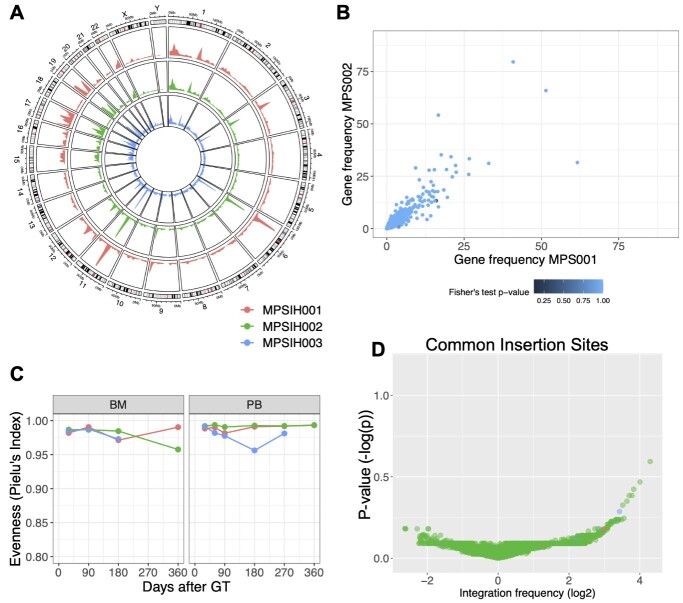
Figure 4.
Clonal tracking in MPSIH patients. (A) Plotted results of the analysis workflow for MPSIH clinical trial data. (A) Circos plot representation of genomic distribution IS for the first three patients MPSIH001 (in red), MPSIH002 (in green) and MPSIH003 (in blue). (B) Scatter plot of the comparison between genomic tracks between patients 1 and 2. Each data point represents a gene that has coordinate the gene frequency of patient 1 (on x axis) and the gene frequency of patient 2 (on y axis). Points are colored according to their P-value for the Fisher’s exact test and are eventually highlighted and labeled in red if the P-value is lower than the set significance threshold for the test (by default 0.05); here no genes resulted significantly different. (C) Clonal population evenness (Pielu’s index, y-axis) over time (x-axis) retrieved in whole bone marrow (BM) and peripheral blood (PB). (D) Volcano plot of the results for CIS-Grubbs test, representing on x-axis the gene integration frequency (expressed in log2) and on y-axis the average P-value resulted by the Grubbs test (−log P-value) among the first three patients.

