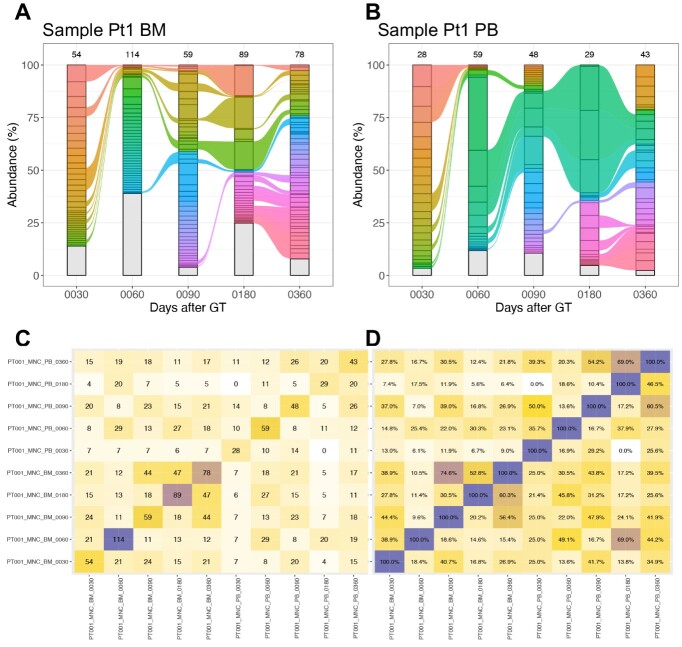
Figure 5.
Streamgraphs for clonal abundance and IS sharing. (A, B) Streamgraphs of the clonal abundance calculated from the package included sample data, both refer to MNC cell populations in patient 1 (Pt1) in two different tissues (bone marrow—BM in A, peripheral blood—PB in B). Colored ribbons indicate a relative clonal abundance >1% in at least one time point, all IS below this threshold are grouped together in the gray strata. (C) Absolute number of distinct IS shared between samples visualized as colored heatmap (square matrix). In the example, each row identifies a sample (named with patient id, cell marker, tissue and time point in days). Within each cell is reported the number of shared IS expressed as absolute number (C) or relative percentage (D).

