Figure 7.

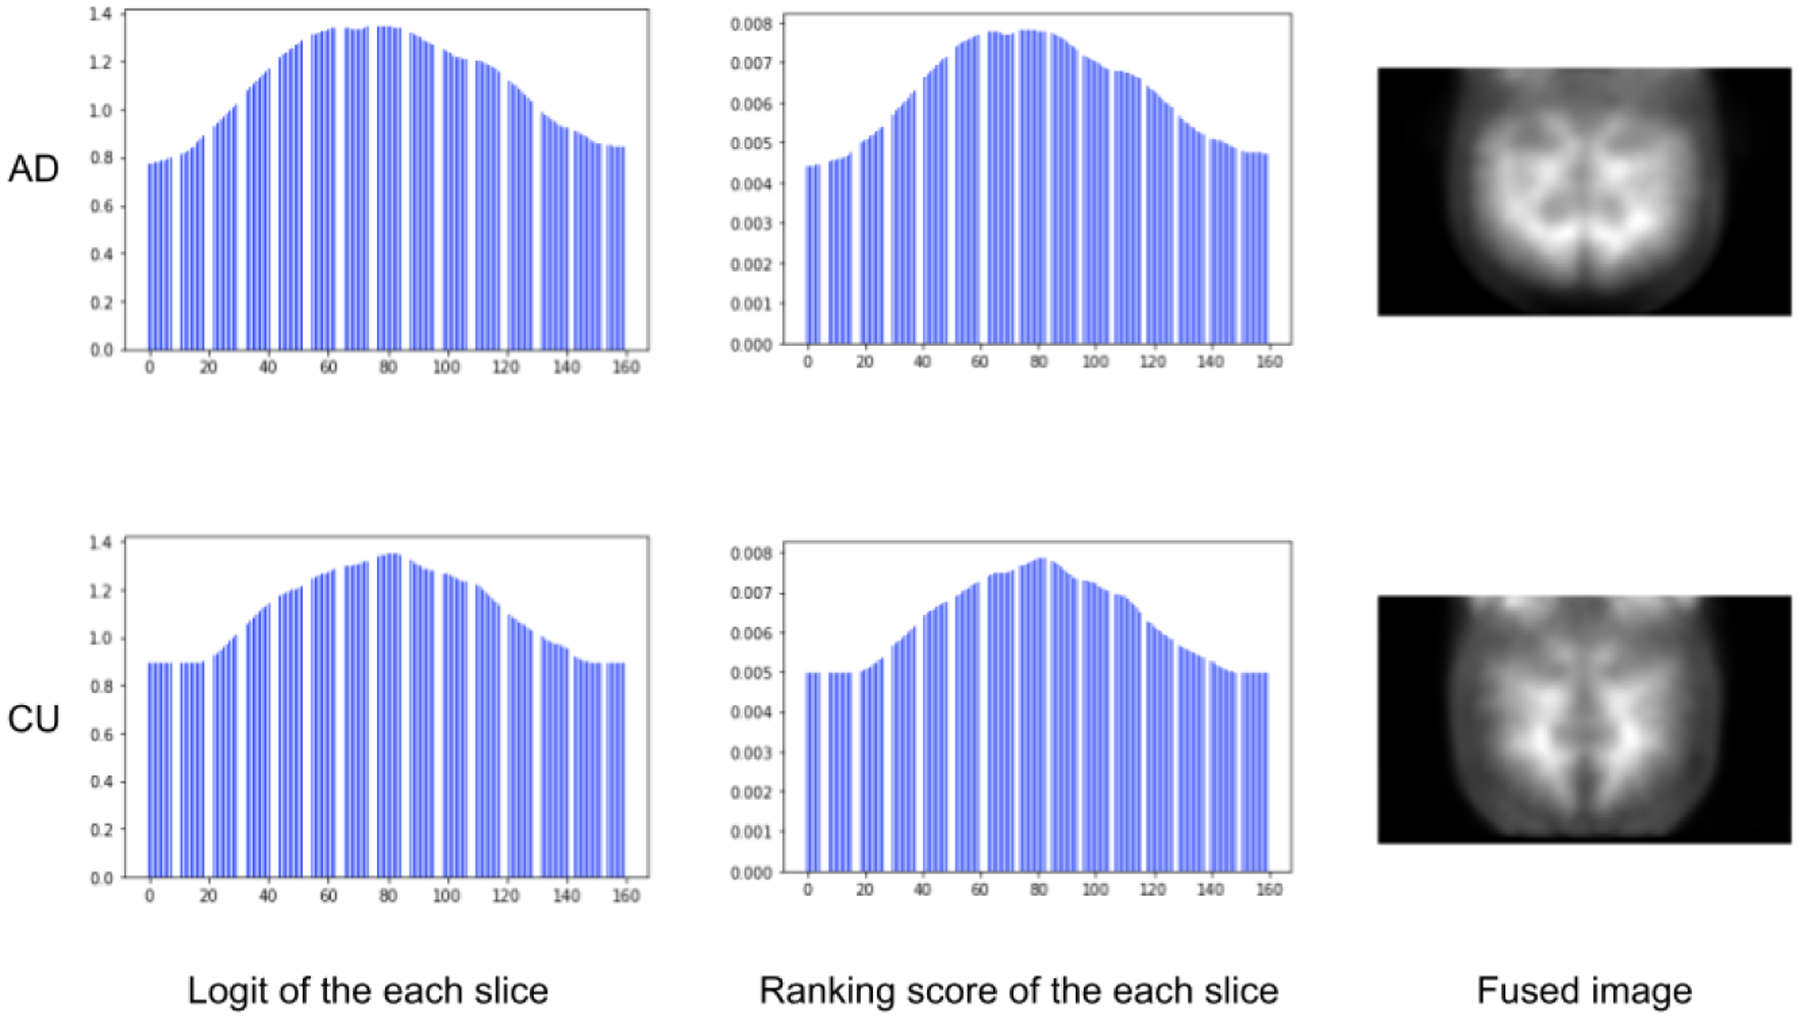
The visualization results of the PET image. The first column shows the digit of each slice. The second column shows the rank score of the slices after the softmax function. The last column shows the fused PET image.

The visualization results of the PET image. The first column shows the digit of each slice. The second column shows the rank score of the slices after the softmax function. The last column shows the fused PET image.