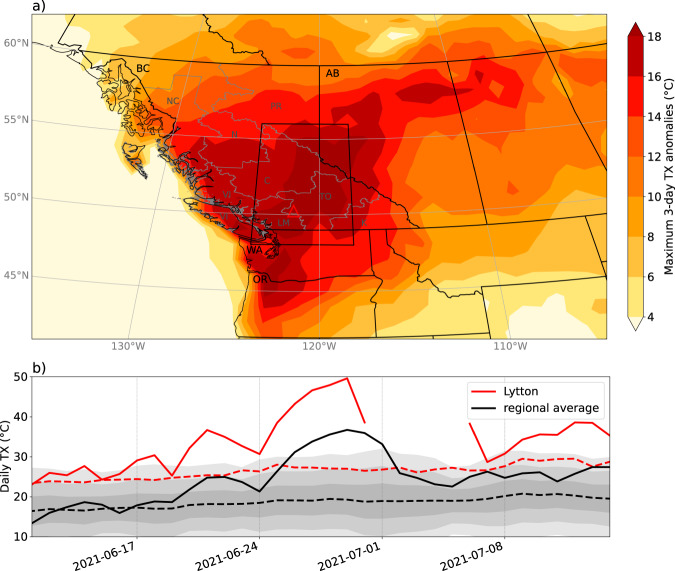
Fig. 1. June 2021 Pacific Northwest heatwave temperatures.
Heatwave daily maximum near-surface (2 m) temperatures (TX). a ERA5 reanalysis data maximum 3-day running mean (between 23 June and 02 July 2021) of TX anomalies relative to a daily 1981–2020 climatology (see Methods for more details). b Absolute TX values for 2021 (solid) and 1981–2020 climatology (dashed); black lines: spatial average of ERA5 data over the black box in a, with shading ±1, 2, and 3 standard deviations; red lines: observations from Lytton, British Columbia (BC), denoted by the red triangle in a—missing values from 1 to 5 July are likely due to the wildfire. Black letters and outlines in a show the main Canadian provinces and US states referred to in this study. Gray outlines and letters in a show the eight crop regions in BC, discussed further in the section on Agricultural Yields.

